Introduction:
As more are more applications are moving to private or public cloud environments as part of modernization by adopting new microservices architecture, they are being containerized using Docker and are orchestrated using Kubernetes as popular platform choices. Kubernetes does offer many advanced features and great flexibility, making it suitable for complex and large-scale applications, however, it has a steeper learning curve requiring more time, effort and resources to set up, monitor and manage for simpler applications where these advanced features may not be needed.
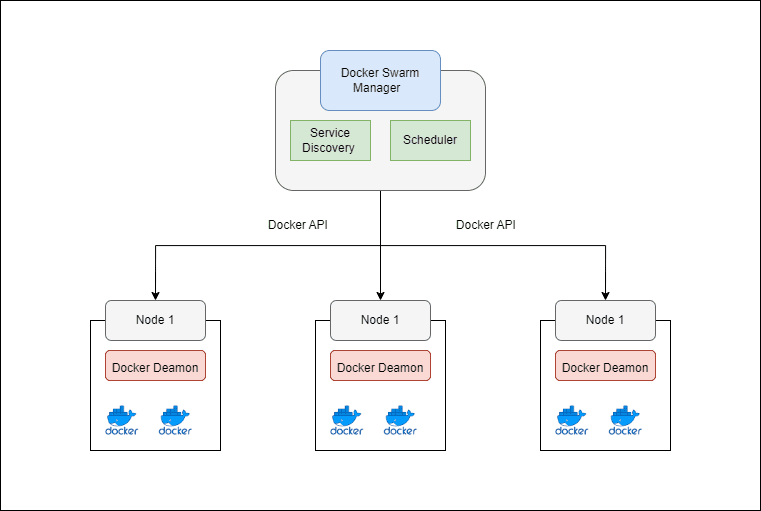
Docker Swarm is another open-source orchestration platform with a much simpler architecture and can be used to do most of the activities that one does with Kubernetes including the deployment and management of containerized applications across a cluster of Docker hosts with built-in clustering capabilities and load balancing enabling you to manage multiple Docker hosts as a single virtual entity.
Swarmpit is a little-known open-source web-based interface which offers a simple and intuitive interface for easy monitoring and management of the Docker Swarm cluster.
In this article, we walk through the process of setting up a Docker Swarm cluster with one master node and two worker nodes and configure Swarmpit to easily manage and monitor this Swarm Cluster.
Problem Statement
Managing containerized applications at scale can be challenging due to the complexity of handling multiple nodes, ensuring high availability, and supporting scalability. Single-node deployments limit redundancy and scalability, while manually managing multiple nodes is time-consuming and error-prone.
Docker Swarm addresses these challenges with its clustering and orchestration capabilities, but monitoring and managing the cluster can still be complex. This is addressed using Swarmpit.
Use Cases
- High Availability: Ensure your application remains available even if individual nodes fail.
- Scalability: Easily scale services up or down to meet demand.
- Simplified Management: Use a single interface to manage multiple Docker hosts.
- Efficient Resource Utilization: Distribute container workloads across multiple nodes.
Why Choose Docker Swarm Over Kubernetes?
Docker Swarm is an excellent choice for smaller or less complex deployments because:
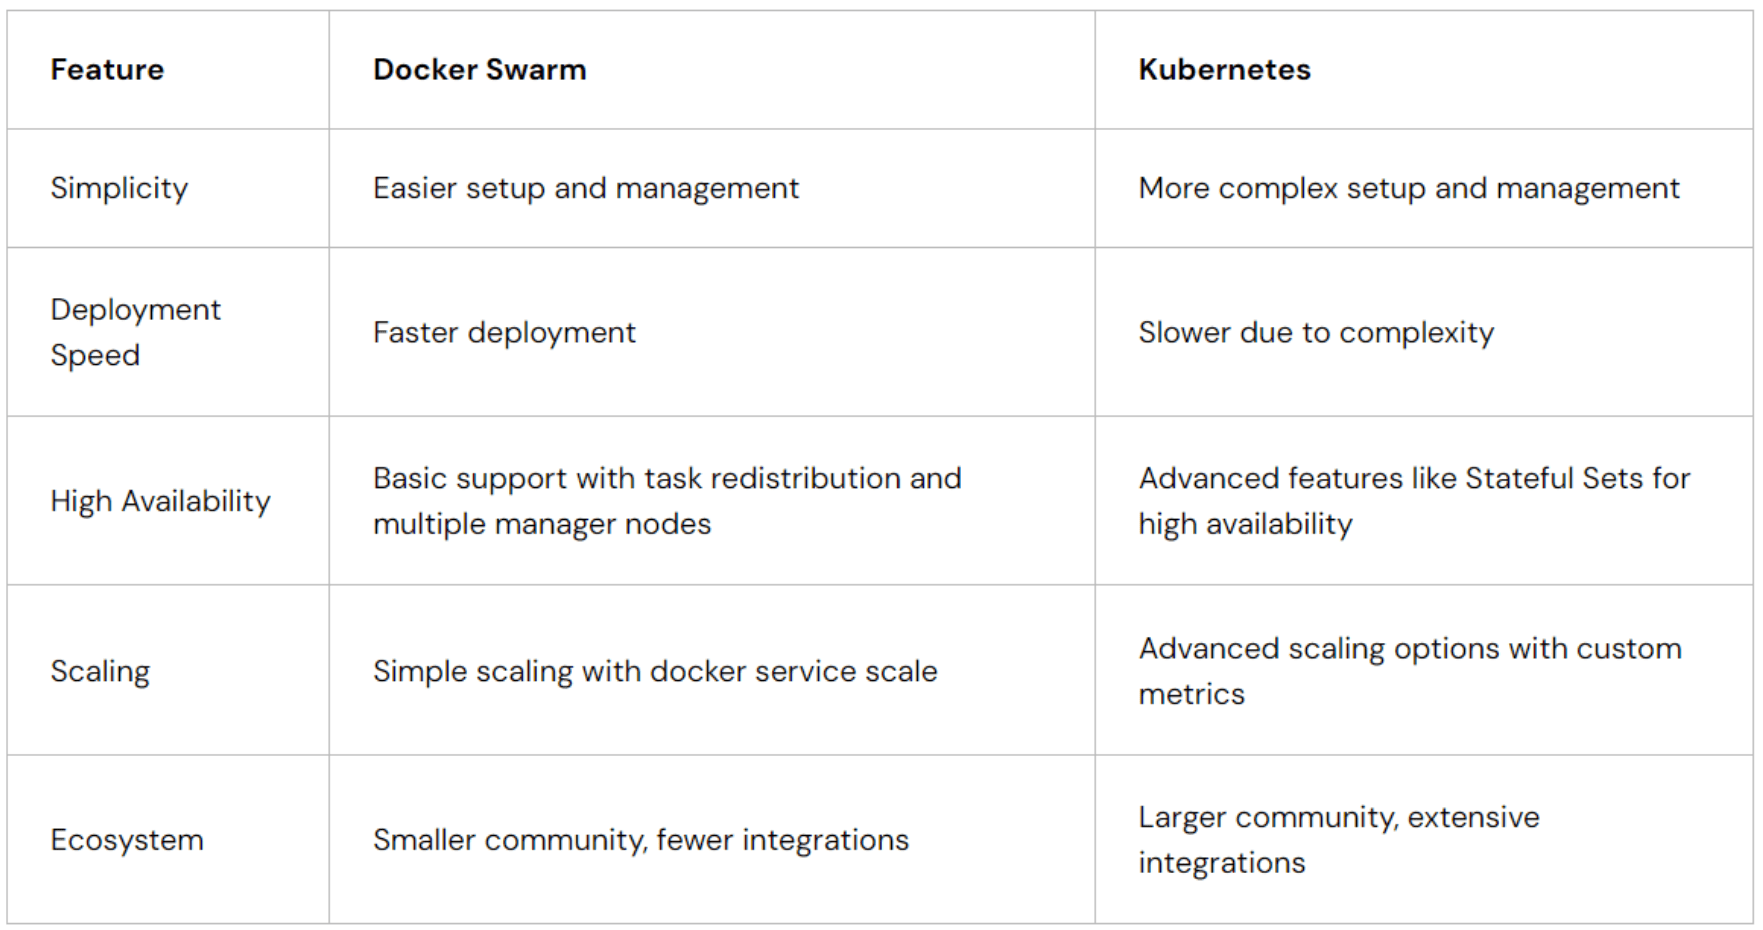
- Simplicity and Ease of Use: Docker Swarm is easier to set up and manage compared to Kubernetes. It integrates seamlessly with Docker’s command line tools, making it simpler for those already familiar with Docker.
- Faster Deployment: Swarm allows you to get your cluster up and running quickly without the intricate setup required by Kubernetes.
- High Availability and Scaling: Docker Swarm effectively manages high availability by redistributing tasks if nodes fail and supports multiple manager nodes. Scaling is straightforward with the docker service scale command and resource constraints. Kubernetes offers similar capabilities but with more advanced configurations, like horizontal pod autoscaling based on custom metrics for finer control.
Limitations of Docker Swarm
- Advanced Features and Extensibility: Docker Swarm lacks some of the advanced features and customization options found in Kubernetes, such as detailed resource management and extensive extensions.
- Ecosystem: Kubernetes has a larger community and more integrations, offering a broader range of tools and support.
While Kubernetes might be better for complex needs and extensive customization, Docker Swarm offers effective high availability and scaling in a more straightforward and manageable way for simpler use cases.
Comparison:
Prerequisites
Before you start, ensure you have the following:
- Three Ubuntu machines with Docker installed.
- Access to the machines via SSH.
- A basic understanding of Docker and Docker Compose.
Setting Up the Docker Swarm Cluster
To start, you need to prepare your machines. Begin by updating the system packages on all three Ubuntu machines. This ensures that you are working with the latest software and security updates. Use the following commands:
sudo apt update
sudo apt upgrade -y
Next, install Docker on each machine using:
sudo apt install -y docker.io
Enable and start Docker to ensure it runs on system boot:
sudo systemctl enable docker
sudo systemctl start docker
It is essential that all nodes are running the same version of Docker to avoid compatibility issues. Check the Docker version on each node with:
docker –version
With the machines prepared, go to the instance where you want the manager node to be present and run the command below.
docker swarm init
This will initialize the swarm process and provide a token using which you can add the worker node.
Copy the above-given command by the system and paste it into the instance or machine where you need the worker node to be present. Now both the manager and worker’s nodes are ready.
Once all nodes are joined, verify that the Swarm is properly configured. On the master node, list all nodes using:
docker node ls
This command should display the master node and the two worker nodes, confirming that they are part of the Swarm. Additionally, you can inspect the Swarm’s status with:
docker info
Check the Swarm section to ensure it is active and reflects the correct number of nodes.
To ensure that your cluster is functioning as expected, deploy a sample service.
Create a Docker service named my_service with three replicas of the nginx image:
docker service create –name my_service –replicas 3 nginx
Verify the deployment by listing the services and checking their status:
docker service ls
docker service ps my_service
Managing and scaling your Docker Swarm cluster is straightforward. To scale the number of replicas for your service, use:
docker service scale my_service=5
If you need to update the service to a new image, you can do so with:
docker service update –image nginx:latest my_service
Troubleshooting Common Issues
Node Not Joining the Swarm
- Check Docker Version: Ensure all nodes are running compatible Docker versions.
- Firewall Settings: Make sure port 2377 is open on the master node.
- Network Connectivity: Verify network connectivity between nodes.
Deploying Swarmpit for Monitoring and Management
Swarmpit is a user-friendly web interface for monitoring and managing Docker Swarm clusters. It simplifies cluster administration, providing an intuitive dashboard to monitor and control your Swarm services and nodes. Here’s how you can set up Swarmpit and use it to manage your Docker Swarm cluster.
Deploy Swarmpit Container
On the manager node, deploy Swarmpit using the following Docker command:
docker run -d -p 8888:8888 –name swarmpit -v /var/run/docker.sock:/var/run/docker.sock swarmpit/swarmpit:latest
Access the Swarmpit Interface
Open your web browser and navigate to http://<manager-node-ip>:8888. You will see the Swarmpit login page. Use the default credentials (admin/admin) to log in. It is recommended to change the default password after the first login.
Using Swarmpit for Monitoring and Management
Once you have logged in, you can perform a variety of tasks through Swarmpit’s web interface:
Dashboard Overview
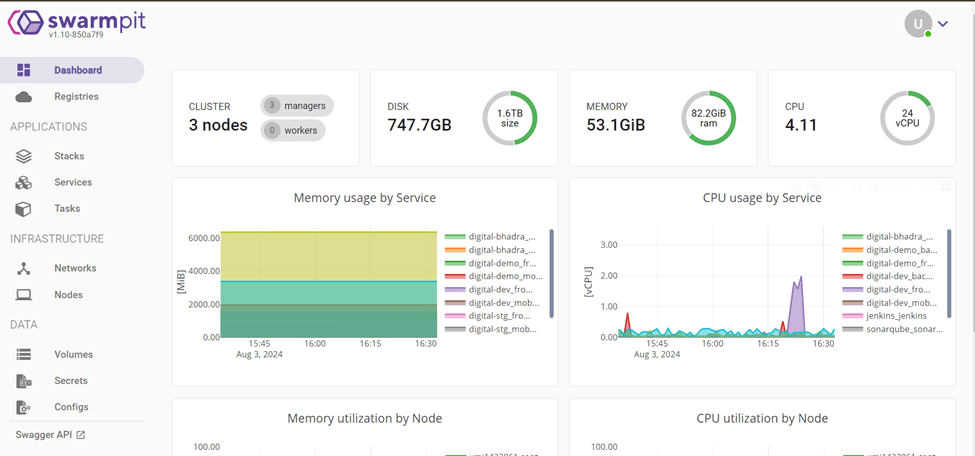
○ Cluster Health: Monitor the overall health and status of your Docker Swarm cluster.
○ Node Information: View detailed information about each node, including its status, resources, and running services.
Service Management
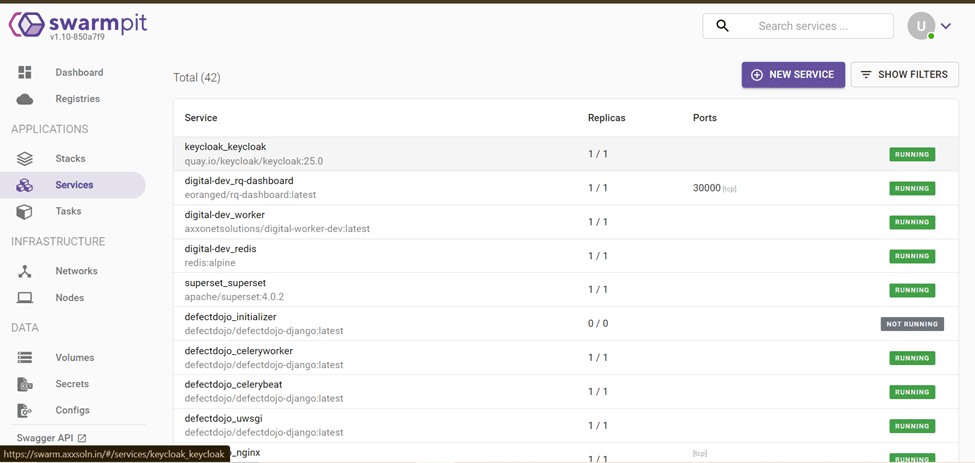
- Deploy Services: Easily deploy new services by filling out a form with the necessary parameters (image, replicas, ports, etc.).
- Scale Services: Adjust the number of replicas for your services directly from the interface.
- Update Services: Change service configurations, such as updating the Docker image or environment variables.
- Service Logs: Access logs for each service to troubleshoot and watch their behavior.
Container Management
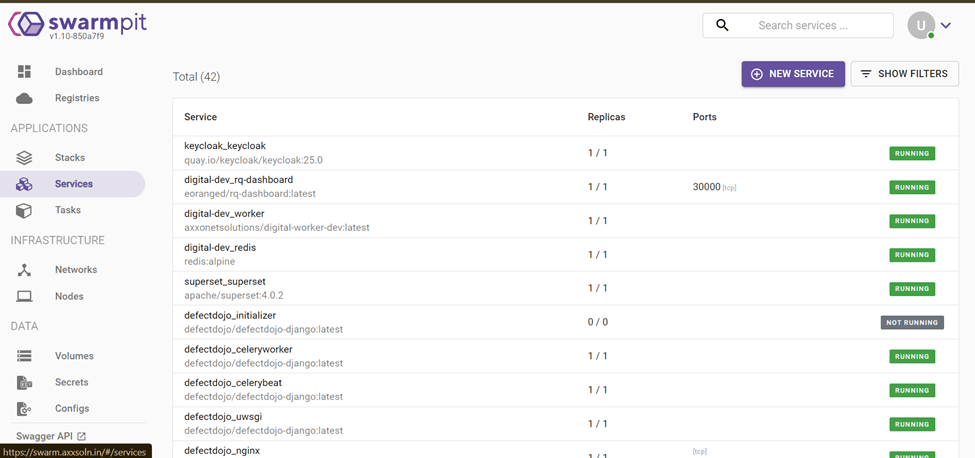
- View Containers: List all running containers across the cluster, including their status and resource usage.
- Start/Stop Containers: Manually start or stop containers as needed.
- Container Logs: Access logs for individual containers for troubleshooting purposes.
Network and Volume Management
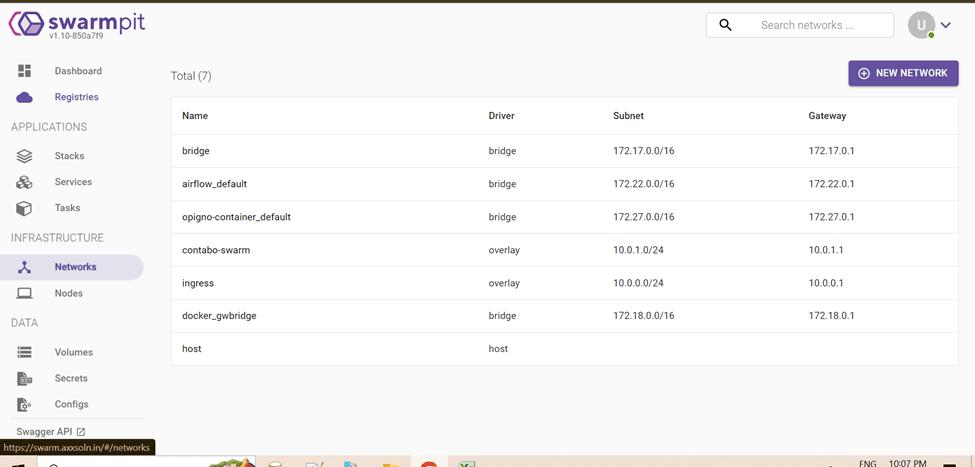
- Create Networks: Define and manage custom networks for your services.
- Create Volumes: Create and manage Docker volumes for persistent storage.
User Management
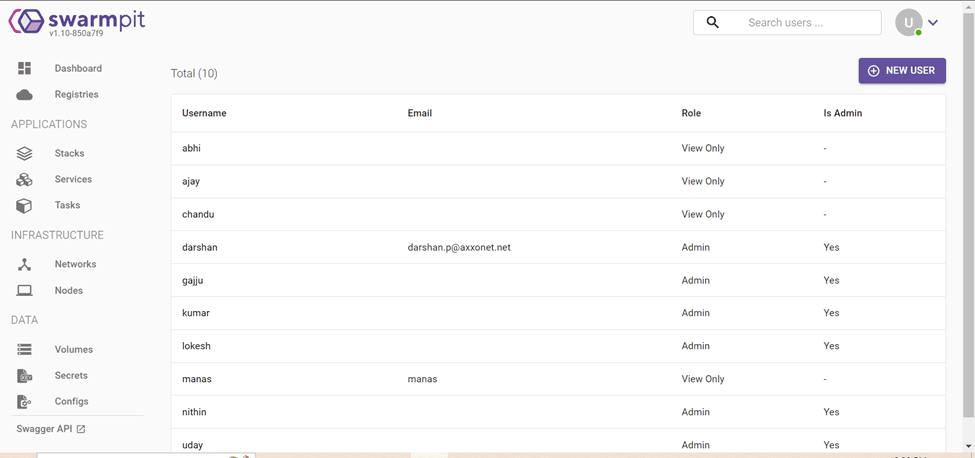
- Add Users: Create additional user accounts with varying levels of access and permissions.
- Manage Roles: Assign roles to users to control what actions they can perform within the Swarmpit interface.
Benefits of Using Swarmpit
- User-Friendly Interface: Simplifies the complex task of managing a Docker Swarm cluster with a graphical user interface.
- Centralized Management: Provides a single point of control over all aspects of your Swarm cluster, from node management to service deployment.
- Real-Time Monitoring: Offers real-time insights into the health and performance of your cluster and its services.
- Enhanced Troubleshooting: Facilitates easy access to logs and service status for quick issue resolution.
Conclusion
By integrating Swarmpit into the Docker Swarm setup, we get a powerful tool that streamlines cluster management and monitoring. Its comprehensive features and intuitive interface make it easier to maintain a healthy and efficient Docker Swarm environment, enhancing the ability to deploy and manage containerized applications effectively.
