Why Choose Grafana? A Comprehensive Alerting System Compared to Nagios, Datadog, Elastic Stack, and Splunk
With the emerging world of data, monitoring and alerting systems have become vital to maintaining the reliability of applications and infrastructure. With tons of data produced every single second, businesses require powerful tools to present this data and quickly react to any incidents. Grafana — the leading open-source technology for monitoring and observability — is already among the most popular tools teams use to convert raw data into actionable real-life insight.
In this article, we will discuss how Grafana is the complete alerting system, showing how it compares to other monitoring tools, including Nagios, Datadog, Elastic Stack & Splunk. By comparing the pros and cons of each, readers can formulate a better sense of what Grafana is capable of and if it’s the right choice for their organization’s monitoring needs.
What is Grafana?
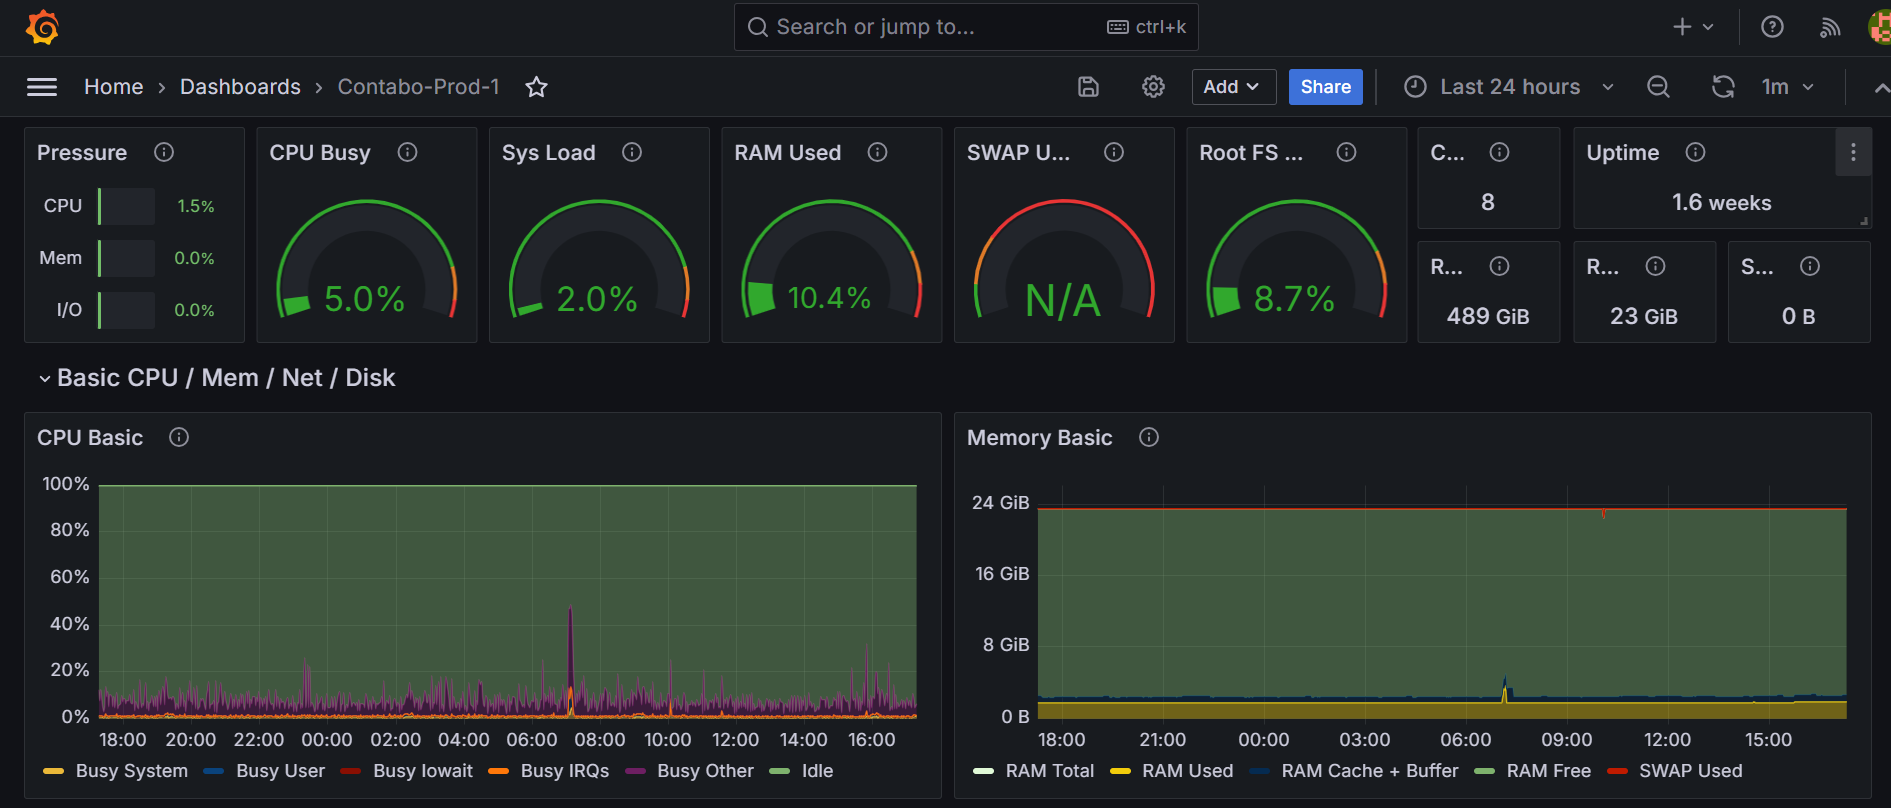
Grafana is a free platform used for monitoring, visualization, and analytics. It allows its users to turn large and complex datasets into informative visualizations by giving them the option of creating interactive and customizable dashboards. Monitoring of applications, services, and infrastructure can be done in real time with the help of Grafana, which makes it a good tool for teams, having a user-friendly interface. Therefore, it works exceedingly well for DevOps as well as IT operations.
It can work with an extensive range of data sources, such as Prometheus, InfluxDB, MySQL, Elasticsearch, etc. This means that adding Grafana to your display will allow you to see data from many systems all on one dashboard.
Additionally, dashboards in Grafana are also customizable, allowing users to present their data according to their requirements and preferences. Bar graphs, Heatmaps, and tables are some of the forms that can be used for data presentation depending on the metrics.
Also, the development of Grafana is aided by its active user base that helps monitor and alert users by contributing towards developing plugins and writing extensive documentation. Now, users will never feel lost in any application since there will always be installation guides and help provided.
Overview of Competing Tools
Nagios
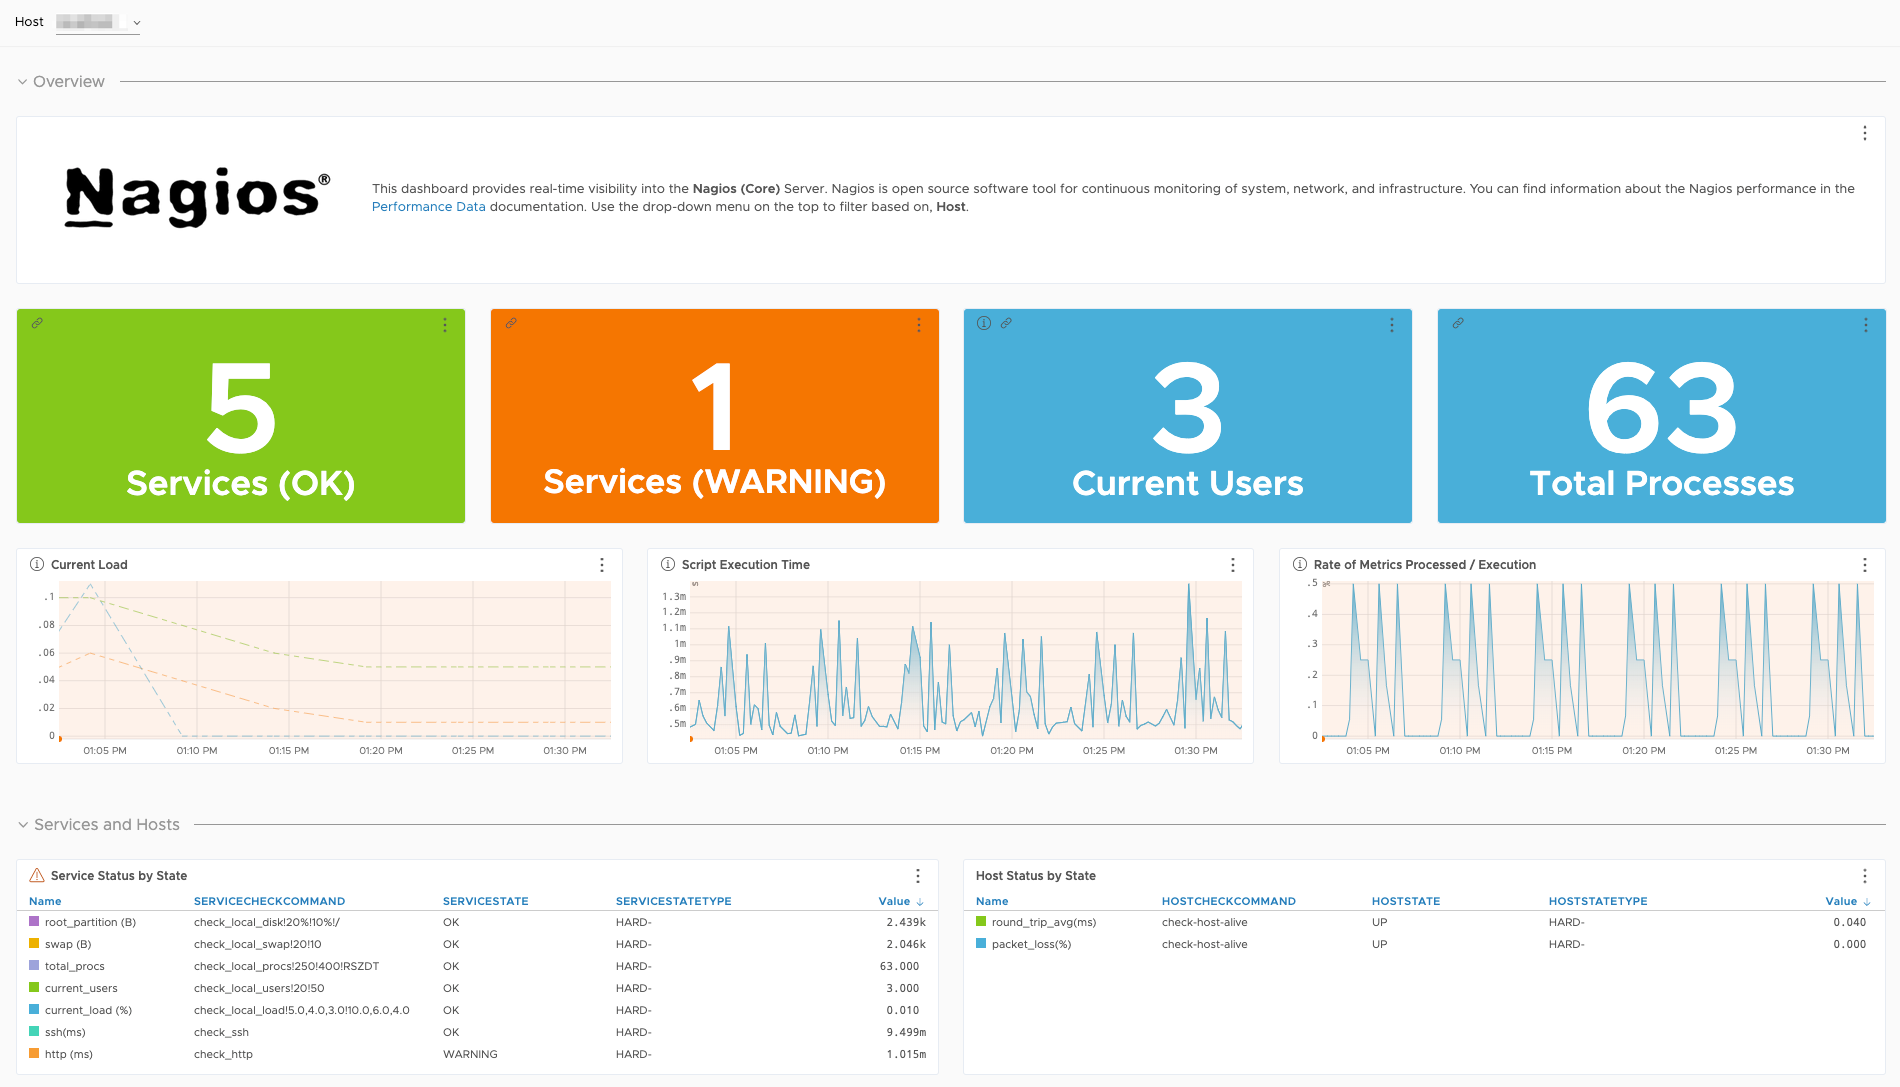
Nagios is a monitoring solution whose service is based on infrastructure that has been in operation for several years. One of its strongest points includes user alerting, which has made it possible for users to keep track of application health, network performance, and server uptime. While it is accurate to say that there exists a robust alerting framework, the Nagios GUI is very tedious to navigate, and there is often a large manual workload for configuring alerts.
Datadog
Datadog is relatively new on the market, offering an application performance management and monitoring solution, entirely cloud-based, that provides visibility across your applications and infrastructure in its entirety. It works well with several cloud-based systems allowing its users to gather metrics, logs, and traces within seconds. It’s, quite literally, a powerful alerting system that enables keeping an eye on an application’s performance and infrastructure at any given moment. Unfortunately, its expensive model could be a deterrent for small organizations as once the level of use of the service increases, the cost would too.
Elastic Stack (ELK)
Elastic Stack, colloquially known as ELK, encompasses three tools – ElasticSearch, Logstash, and Kibana. This enables both analysis and visualization of logs. However, its capabilities get particularly enhanced when being used to process large amounts of log data. Thus, for organizations with a log-centric focus, ELK is a preferred choice. You can also set alert-based patterns via either the ElastAlert tool or using native alerting features provided in Kibana. It is worth noting though that maintaining and keeping the ELK stack up and running would require significant expertise and resources.
Splunk
Turning our attention to Splunk, we see that it currently reigns in the field of operational intelligence. More specifically, they provide real-time analysis and insights into machine-generated data. What puts Splunk at the forefront in terms of service, is that it combines effective analytics with an advanced search feature. Thereby allowing the organization to reduce their incident response time significantly. Splunk’s alerting system is arguably intricate as it doesn’t entirely allow for great customization, setting up alerts based on complex queries is doable. The downside, however, is a rather expensive licensing model. Splunk is notoriously expensive with their pricing model making scaling a challenge when trying to push them to their limits.
Feature | Grafana | Nagios | Datadog | Elastic Stack (ELK) | Splunk |
Primary Focus | Visualization, monitoring, and alerting across multiple data sources | Infrastructure monitoring and alerting | Cloud-native monitoring and observability | Log analysis, search, and visualization | Data analysis, real-time insights, and log management |
Alerting System | Unified alerting, customizable alerts across multiple data sources | Static alerts, tied to host/service monitoring | Extensive, integrated alerting for metrics and logs | Basic alerting with the additional configuration required | Advanced alerting with machine learning (ML) models |
Ease of Use | User-friendly, intuitive UI, low learning curve | Complex setup, higher learning curve | Easy-to-use, modern cloud-native interface | Moderate complexity requires an Elasticsearch setup | Complex requires a deep understanding of configuration |
Customization | Highly customizable dashboards support multiple data sources | Less flexible, more manual configuration | Highly customizable, SaaS-based with many options | High level of customization through Elasticsearch and Kibana | Highly customizable, but complex for large deployments |
Notification Channels | Supports multiple channels: Slack, PagerDuty, email, Teams | Limited notification options, typically email | Broad range: Slack, email, PagerDuty, webhooks | Limited out-of-the-box, requires integration | Advanced notification options, but complex to set up |
Integration | Integrates with Prometheus, Loki, Elasticsearch, MySQL, Pand PostgreSQL | Integrates with third-party plugins and services | Extensive cloud integration (AWS, Azure, GCP) | Deep integration with Elasticsearch for log analysis | Supports numerous services, but the complex integration process |
Visualization | Best-in-class, customizable, interactive dashboards | Limited visualization capabilities | Advanced visualizations for metrics, logs, traces | Good visualization through Kibana, customizable | Strong visualization but more for advanced users |
Scalability | Scales well with time series databases like Prometheus | Limited scalability without external tools | Excellent scalability for cloud and large deployments | Scales with Elasticsearch clusters | Scales well, but resource-intensive and costly |
Community and Support | Strong open-source community, rich plugin ecosystem | Large community, but more focused on plugins | Strong support via SaaS, extensive documentation | Active open-source community, with paid support options | Strong enterprise support, but costs are high |
Cost | Open-source, with paid enterprise options | Open-source, but requires third-party integrations for advanced features | Paid SaaS, usage-based pricing | Open-source (free), paid enterprise options available | Expensive enterprise-level pricing |
Grafana’s Alerting Features
The skills of monitoring teams are significantly enhanced by Grafana’s alerting system which is quite robust and flexible to use. Central to this functionality are the alert rules, which enable the user to impose limitations on metrics, logs, and traces. With Grafana’s Unified Alerting system that was embedded with the software version 8, the user can operate different alerts from a single point, whereby fetching data from sources such as Prometheus, Loki, and Elasticsearch. This single-point management system is more effective in alert management as opposed to the Nagios-based swift tools that are closely tied to alerting tools and thus result in a disintegrated monitoring setup.
Grafana has the ability to alert a wide array of users and the alerting setup is another defining factor that has set Grafana aside from the others. Users can make advanced queries through their integrations with Prometheus by utilizing PromQL allowing them to build risks inside the metrics which can then be used for alerts. Also, Grafana integrates lots of notification channels such as PagerDuty, Slack, Microsoft Teams, and webhooks, among others. Such diversity assists the teams in instilling alerts over their communication workflows as it suits them best.
With Grafana’s contextual alerting, usability is improved as it binds alerts with relevant graphs. There is also a setting where a graph is displayed whenever an alert is triggered, making the diagnosis of the issue easier. Moreover, in the process of solving the problem, it is also beneficial that Grafana automatically marks events on graphs so users know when and where the problem was.
The platform also avoids alert fatigue through alert grouping and deduplication. Several alerts can be sent as one instead of a barrage of messages which greatly enhances communication and cuts out unwanted sounds. With Prometheus, Grafana allows users to not be burdened with constant notifications of similar types due to alert deduplication use.
Overall, the simple interface of Grafana makes any command related to setting alerts extremely easy, which is beneficial for new users while not compromising the experience of professionals. The API of the platform is also very helpful in automation as it allows integration with CI/CD pipelines and up-to-date DevOps processes. Such simplicity in work, in combination with powerful alerting features, is what makes Grafana a good tool for any company in need of a deep monitoring system.
Comparison of Alerting Systems
User Interface and Experience
Grafana is a better experience in terms of its user interface and experience as its design is more friendly. Users design the platform in such a way that navigating through its features becomes easy, which makes setup and management straightforward for those who are not familiar with monitoring tools. This stands in stark contrast to systems such as Nagios and Splunk which are a little bit easier to use but come with a complexity that requires a lot of time and effort to understand. For example, in Nagios, setting up alerts frequently requires sifting through configuration files and using a command-line interface which may turn out to be a pretty intimidating task for users with a limited technical background. Splunk, on the other hand, is a great tool but it also requires teams to understand how to use its query language and how to configure the tool which slows down the initial deployment of the team.
Alert Configuration
Grafana enhances alert management via a single unified system which allows users to define alert notifications based on any visualization or metrics from multiple data sources. Thanks to Prometheus and PromQL, complex alert conditions can easily be met, allowing for changes in response to conditions occurring. Note that Nagios, on the other hand, makes it necessary to adjust manually every alert which might unify some systems, but make several errors. Splunk is more advanced, yes, but the way search queries need to be configured can be a bit more than any user would want to deal with.
Notification Flexibility
Grafana shines in its flexibility in notification channels, where it supports an enormous number of notification channels: email, Slack, PagerDuty, and Microsoft Teams, among others. This means alerts can be pushed to the correct teams in real-time, enabling prompt responses to issues. Datadog and Elastic Stack also offer several options for notifications; however, being open-source, Grafana offers far more customization and integration opportunities. For organizations looking to customize their alerting processes in order to fit with particular workflows, Grafana is a more flexible solution.
Scalability
Scalability is one important factor for an organization, particularly as the need to monitor scales up and becomes very large. In this respect, Grafana has a good architecture that can scale effectively with data sources, such as Prometheus, which are designed to have high availability and scalability, which makes it perfect for large environments. However, Datadog is also scalable but becomes expensive with more data. Built with robust scalability options, the Elastic Stack may be a bit complex in terms of management. What Grafana does well is it captures the powerful monitoring features without incurring the high costs of some cloud-native products.
Integration with Existing Systems
Its biggest advantage is its seamless integration with other systems that may already exist in an organization. It supports multiple data sources such as Prometheus, Loki, Elasticsearch, and many more. Therefore, the existing tools are easily utilized by organizations with less disruption. It allows teams to see and alert on data coming from different sources in one place, thus making it a smooth workflow. And though Nagios and Splunk, for example, tend to be siloed products that may only more readily work with other systems with more configurations or separate instances, the integration of APIs and webhooks into Grafana increases its flexibility in deployment in various workflows. Such a feature explanation makes it appealing to teams that want to enhance the monitoring and alerting capabilities without overhauling their existing processes.
Conclusion
Grafana’s alerting system provides a great balance of visual appeal, flexibility, and ease of use, which makes it a great contender for organizations looking to enhance their monitoring capabilities. The unified alerting framework, support for multiple data sources, and rich community support help teams manage alerts effectively while reducing noise and improving response times.
Grafana can be a perfect choice for those organizations that are searching for an all-around monitoring stack. It complements other tools that are very strong in areas like log analysis or deep metrics monitoring. This way, the organization can get an even more complete solution for varied operational needs.
Empower Your Business with Data-Driven Insights. Reach out to us today!
Frequently Asked Questions (FAQs)
Grafana focuses on data visualization and dashboarding, whereas Nagios is more traditional in the system and network monitoring. Grafana supports multi-source data integration and is highly customizable for visual representations, while Nagios excels in alerting and plugin-based monitoring.
You can customize Grafana dashboards by adding panels for different data sources, applying custom queries, and using built-in or third-party plugins to tailor the visualization. The layout and metrics displayed can be configured to suit your monitoring preferences.
Prometheus can be easily integrated with Grafana as a data source. Grafana pulls data from Prometheus using its API and allows you to create dynamic dashboards based on the time-series data collected by Prometheus.
Some popular plugins include the Zabbix plugin for Zabbix integration, Loki for log monitoring, and the Pie Chart plugin for specific visualizations. Plugins for cloud services like AWS and Google Cloud also extend Grafana's monitoring capabilities.
Splunk is a powerful tool for log analysis and management, with advanced search capabilities. Grafana, on the other hand, excels at real-time data visualization from multiple sources and is often used alongside Prometheus for metrics monitoring. Splunk is more enterprise-focused, while Grafana offers flexibility in open-source and cloud-native environments
Unified Alerting is Grafana's system for managing alerts across multiple data sources. You can configure it by setting up conditions for metrics or logs that trigger alerts, and by defining notification channels like email, Slack, or webhook for sending alerts.
Grafana allows you to connect and visualize data from multiple sources like Prometheus, Loki, Elasticsearch, InfluxDB, and more, all in one dashboard. You can configure queries for each data source and display the results in different panels on the same dashboard.
The ELK stack (Elasticsearch, Logstash, Kibana) is a comprehensive solution for log aggregation, search, and analysis, whereas Grafana is primarily focused on metrics and visualization. Grafana, when used with Loki, can handle logs but lacks the deep search and indexing capabilities of ELK.
Grafana is often preferred for open-source, highly customizable setups, while Datadog offers an all-in-one solution with built-in metrics, logs, and traces for cloud environments. Datadog provides a more managed experience but at a higher cost.