Executive Summary
Your software testing strategy is a financial decision, not just a technical one. Every flaky test that triggers a rerun, every manual wait that stalls a pipeline, every hour an engineer spends chasing phantom failures, these are line items on a cost that most CFOs and CTOs have never been shown.
This guide quantifies that cost, and presents the case for Playwright as the framework that eliminates it. Backed by 2025-2026 market data, independent benchmarks, and a documented enterprise migration case study, it gives technology leaders the business intelligence needed to make a confident, defensible decision.
Playwright now commands a 45.1% adoption rate among QA professionals, a 94% retention rate, and ~30 million weekly npm downloads – dwarfing Cypress (6.5M) and Selenium (flat growth). Amazon, Microsoft, Apple, Walmart, and NVIDIA have already made the move. (TestGuild 2025 / TestDino 2026)
The Problem No One Is Costing Properly
Let us be direct. When a senior engineer at a US software firm earning $150,000 per year spends 30 minutes investigating a test that was not broken, and this happens multiple times per week, the financial bleed is real and compounding.
Research presented at ICST 2024 found that dealing with flaky tests consumes a minimum of 2.5% of productive developer time across large commercial projects. For a 50-person engineering organisation at average US salaries, that figure translates directly into roughly $120,000 in lost productivity annually, before accounting for delayed releases, CI infrastructure costs, or the cultural erosion that comes when developers stop trusting their own pipelines.
The Four Hidden Costs of Flaky Automation:
- CI Compute Waste: Every rerun triggered by a false failure doubles your infrastructure spend on that job. Across hundreds of daily builds, this is not negligible.
- Engineer Time Drain: Microsoft’s research shows the average investigation per flaky test is 30 minutes per occurrence, not per test. Multiply that by frequency.
- Deployment Velocity Loss: PRs blocked by unreliable signals sit in review limbo. Merge conflicts compound. Deploys the batch into riskier, larger releases.
- Cultural Damage: Once developers assume failures are probably just flaky, real bugs get waved through. The test suite loses its credibility as a quality gate. Rebuilding trust takes months.
A team of 30 engineers with a poor flaky-test culture can burn over $20,000 per month in lost productivity alone, before a single CI instance is counted. (DEV Community / Autonoma Research, 2026)
The Automation Market Is Accelerating And Framework Choices Now Define Winners
The global automation testing market reached $35.52 billion in 2024 and is projected to reach $169.33 billion by 2034, growing at a CAGR of 16.9%. This is not a niche technical investment – it is infrastructure for competitive differentiation.
Inside that expansion, a decisive shift in tooling has already occurred. The 2025 State of JS survey, the industry’s most authoritative annual benchmark, recorded Playwright developer satisfaction at 91%, versus Cypress at 72% and a declining Selenium. Playwright job postings grew 180% year-over-year in 2025. The talent market, the adoption data, and the benchmark performance all point in the same direction.
45.1% QA Adoption Rate (TestGuild 2025) | 91% Developer Satisfaction (State of JS 2025) | 30M+ Weekly npm Downloads (TestDino, April 2026) |
Understanding the Framework Landscape
Playwright, Selenium, and Cypress are not interchangeable tools at different price points. They represent fundamentally different philosophies, and those differences carry real financial consequences at scale.
Why Architecture Is A Business Decision
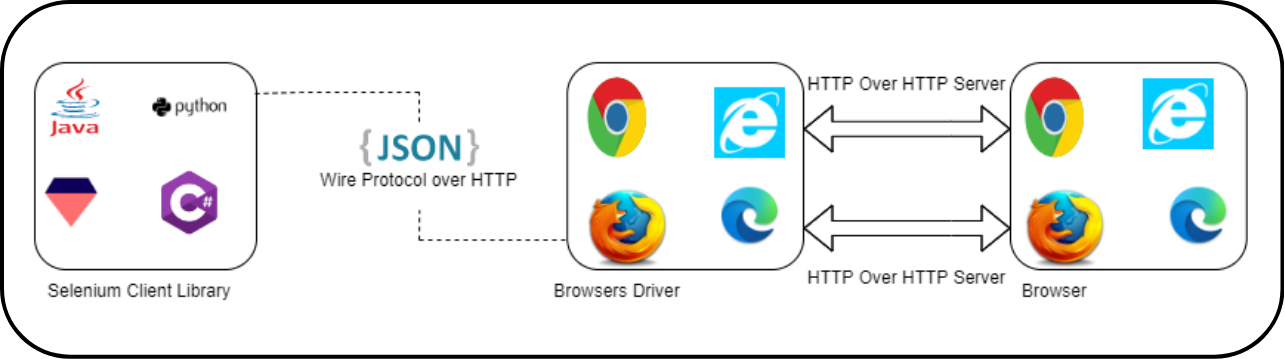
The most important, and most overlooked, difference between these frameworks is the protocol they use to communicate with the browser.
Selenium sends every command as a separate HTTP request. Open browser: HTTP request. Click element: HTTP request. Type text: HTTP request. After each exchange, the connection is terminated and must be re-established. This per-action overhead is why Selenium suites running thousands of daily tests in cloud environments cost 40–50% more in compute than equivalent Playwright suites.
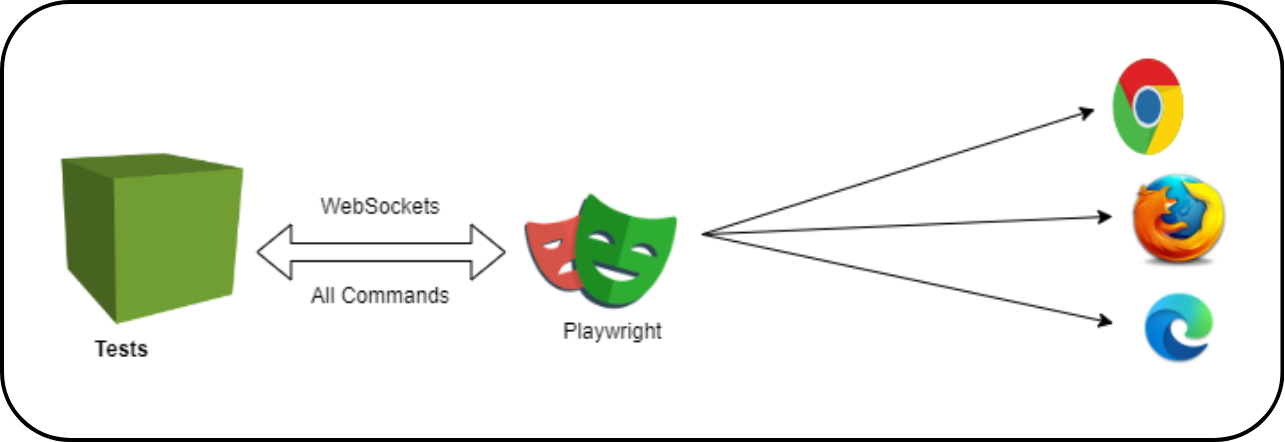
Playwright opens a single WebSocket connection at test start and maintains it through the entire run. Commands are sent instantly, bidirectionally, without re-establishing handshakes. Think of it as the difference between sending a letter for each question versus holding a phone call. The result: faster execution, fewer failure points, and the structural elimination of a category of timing-related flakiness.
Cypress runs tests directly inside the browser’s JavaScript context, an elegant approach that delivers speed for simple front-end validation. However, it cannot test across multiple origins in a single test, requires a paid dashboard for meaningful parallelisation, and its single-threaded architecture creates throughput limits at enterprise scale.
Feature And Performance Comparison
Feature | Playwright | Selenium | Cypress |
Release Year | 2020 | 2004 | 2015 |
Languages | JS, TS, Python, Java, C# | Java, Python, JS, Ruby+ | JS, TypeScript only |
Browser Support | Chromium, Firefox, WebKit | Chrome, Firefox, Safari, Edge, IE | Chrome, Edge, Firefox |
Browser Protocol | WebSocket (persistent) | HTTP/WebDriver (per-request) | In-browser JS injection |
Auto-Waiting | ✓ Built-in | ✗ Manual waits required | ✓ Built-in |
Parallel Execution | ✓ Native, free | External tools needed | Paid Dashboard only |
Test Flakiness | ~8% (lowest) | ~28% | ~19% |
Test Stability Rate | 92% | 72% | 81% |
Built-in Tracing | ✓ Screenshots, video, traces | ✗ Requires plugins | ✓ Limited |
API Testing | ✓ Built-in | ✗ External library needed | ✓ Built-in |
CI/CD Integration | Easy, first-party | Easy | Easy (advanced = paid) |
Mobile Emulation | ✓ Built-in | Via Appium only | ✗ |
Paid Features | None — fully open-source | None | Dashboard & parallelization |
Best For | Modern, scalable enterprise apps | Legacy & diverse stacks | JS-heavy front-end apps |
Learning Curve | Moderate | High | Low |
Speed vs Selenium | ~42% faster | Baseline | ~2× faster than Selenium |
npm Weekly Downloads | ~30 million (2026) | N/A (Java-centric) | ~6.5 million (2026) |
Sources: TestDino 2025, ARDURA Consulting March 2026, tech-insider.org April 2026, State of JS 2025 (released Jan 2026).
What Playwright Actually Delivers
- Auto-Wait: The Structural Elimination of Flakiness
The single most common cause of test flakiness is timing, specifically, tests that interact with elements before those elements are ready. In Selenium, engineers write explicit waits. They guess at timing windows. They tune and re-tune as applications evolve. This is an inherently fragile approach, and it consumes significant engineering hours.
Playwright’s auto-wait mechanism checks that an element is visible, enabled, stable (not animating), and receives pointer events before acting on it. There is no guessing. There are no magic numbers. Timing issues, which account for roughly 45% of all flaky test root causes, are architecturally eliminated. The result across 300+ independently analysed test suites: Playwright achieves 92% stability versus 81% for Cypress and 72% for Selenium (TestDino 2025).
- Speed That Changes CI Economics
In a pipeline running thousands of daily tests, a 42% speed advantage is not an engineering metric; it is a cloud bill. Independent March 2026 benchmarks show Playwright completing sequential suites in 3 minutes 20 seconds versus Selenium at 8 minutes 45 seconds. In CI/CD environments charging per instance-hour, this translates directly into 40–50% infrastructure cost reduction for equivalent coverage.
Playwright’s native parallel execution compounds this. Unlike Cypress, which requires a paid dashboard for parallelisation, Playwright spawns multiple browser contexts within a single process. No extra tooling. No additional licensing. The capacity is built in.
- Real Cross-Browser Coverage
Playwright tests against Chromium (covering Chrome and Edge), Firefox, and WebKit (Safari’s engine), all from a single API, with no additional configuration. For organisations serving global users across devices, this is significant. Safari on iOS remains the second most-used mobile browser globally, and Cypress cannot test it at all.
- Built-in Debugging Infrastructure
When a test fails in CI at 2 AM, the ability to diagnose it without reproducing it locally determines how long a deployment is blocked. Playwright’s built-in tracing captures a full timeline of each test run, DOM snapshots, network requests, console logs, screenshots, and video accessible via a visual trace viewer. No plugins. No external configuration. The diagnostic infrastructure ships with the framework.
- Unified API and API Testing Support
Playwright’s built-in request API allows engineers to make authenticated API calls, seed test data, and validate backend responses within the same framework they use for UI testing. This eliminates a significant source of toolchain complexity and reduces the number of frameworks a team must maintain.
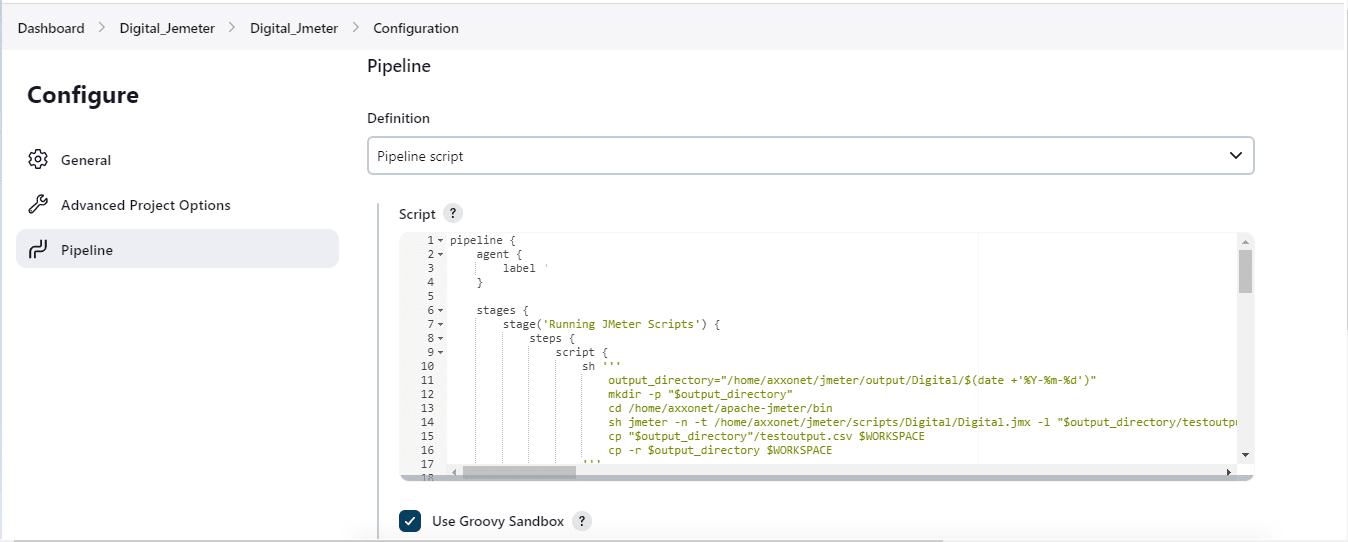
Case Study: What Migration to Playwright Actually Looks Like
We helped a product engineering team migrate a 1,200-test regression suite from Selenium to Playwright. Here is what the data showed.
The Starting Point
The team was running a mature Selenium suite on a CI/CD pipeline with daily execution. The suite was reliable enough to ship on, but increasingly expensive to maintain and slow enough to create bottlenecks at key release gates. Flaky test reruns were consuming 20–30% of CI time. Engineers were spending 30–40% of their QA capacity on maintenance rather than coverage expansion.
The Results
Execution time fell from 25 minutes to 7–12 minutes, a 55-72% reduction. Flaky test reruns dropped by roughly 50%, cutting CI infrastructure costs by 40-60%. Maintenance effort fell by 35-45%, freeing the QA team to expand coverage. Release frequency increased by 20-30%, with fewer pipeline bottlenecks and more predictable deployment windows. Production escape defects fell by an estimated 20-25%, reflecting the improvement in test reliability and signal quality.
ROI: The Business Case in Numbers
ROI = (Benefits − Costs) / Costs × 100
For teams adopting Playwright from Selenium, the financial case is straightforward. The primary cost is migration effort, typically 4-12 weeks for an experienced team, depending on suite size and complexity. The benefits begin accruing immediately and compound:
- CI infrastructure savings of $15,000–$50,000 annually, depending on organisational scale.
- Engineering time recovered from flaky test investigation and reruns: $80,000–$200,000 annually at US salary levels for mid-to-large teams.
- Faster release cycles translate into measurable revenue impact for product businesses.
- Reduced production incidents from improved test signal quality.
Performance And ROI Benchmark Table
Metric | Before Playwright | After Playwright | Improvement |
Test Execution Time | 60–90 min | 30–40 min | ~42–55% faster |
Flaky Test Rate | ~28% (Selenium) | ~8% | 60–70% reduction |
CI Infrastructure Cost | Baseline | –40 to –60% | $15K–$50K saved/yr |
Maintenance Effort | High (manual waits) | Low (auto-wait) | 35–45% reduction |
Release Frequency | Baseline | +20–30% | More deploys/month |
Developer Productivity | Baseline | +30–40% | Less time on reruns |
Test Stability Rate | 72% (Selenium) | 92% | +20 percentage pts |
Framework Satisfaction | 72% (Cypress) | 91% | +19 pts (State of JS 2025) |
Decision Guide: Matching Framework to Business Context
| Choose Playwright when… | You are building or scaling modern web applications. You need CI/CD pipelines that are fast, reliable, and cost-efficient. You want cross-browser coverage (Chromium, Firefox, Safari) with zero extra tooling. Your team measures quality in terms of release velocity and operational cost. You are migrating away from legacy frameworks and cannot afford flakiness at scale. |
| Choose Selenium when… | You maintain legacy enterprise systems requiring broad browser compatibility (including IE). Your organisation has deep Selenium infrastructure and expertise. You need Ruby or PHP test scripting. Mobile testing via Appium is a core requirement. |
| Choose Cypress when… | Your project is front-end focused with a small test suite. Your team is JavaScript-only and prioritises developer experience over scale. You need rapid UI feedback during active feature development. |
| Avoid Playwright when… | You are testing backend APIs, databases, or microservices (use dedicated API tools). Your requirements include legacy browser support (IE11 or older). Your team lacks automation expertise and prefers low-code or no-code solutions. |
Who Is Already Using Playwright?
Over 4,400 verified companies have adopted Playwright, including Amazon, Apple, Microsoft, NVIDIA, and Walmart. These are not pilot programmes they are production pipelines for some of the most complex web applications in the world. (DEV Community, 2025)
Playwright is backed and actively maintained by Microsoft, ensuring long-term investment, rapid feature development, and enterprise-grade reliability. Its architecture was designed from the beginning for modern CI/CD environments. not retrofitted.
“Playwright’s growth is notable. Teams who make the switch consistently report improvements in reliability and execution speed.” – Selenium contributor community (Belitsoft, 2026)
The Risk of Staying Still
There is a version of this decision where the status quo looks safe. Your Selenium suite works. Your team knows it. Migration carries short-term risk. Why move?
Because the costs of flakiness, slow pipelines, and high maintenance do not disappear by ignoring them – they compound. As your application grows in complexity, a framework built on HTTP-per-action and manual wait management becomes increasingly expensive to sustain. Engineering hours are finite. The talent market is shifting toward Playwright (180% YoY job posting growth). And competitors operating on modern automation infrastructure are shipping faster, with more confidence.
The question is not whether to modernise – it is whether to do it on your schedule or under pressure.
Conclusion
Test automation ROI has never been purely about speed. It is about the ability to maintain quality at pace – to ship confidently, frequently, and at a cost that scales with your business rather than against it.
Playwright delivers on all three dimensions. It is architecturally faster than Selenium, more scalable than Cypress, and more reliable than either. The adoption data, the benchmark data, and the enterprise case studies are consistent: organisations that move to Playwright reduce their total cost of ownership, recover engineering time, and gain the release velocity that modern software competition demands.
The automation testing market is growing at 16.9% CAGR toward $169 billion by 2034 (TestDino Market Report 2026). The teams best positioned for that future are building on infrastructure that is reliable, maintainable, and aligned with how modern software is actually built and deployed.
Sources And Further Reading
The following sources informed the statistics, benchmarks, and market data cited in this article:
- TestGuild 2025 Annual QA Survey: Playwright adoption & retention rates
- TestDino: Playwright Market Share Report, April 2026
- TestDino: Playwright Job Market in 2026
- State of JS 2025 (published January 2026). Developer satisfaction scores
- tech-insider.org Playwright vs Cypress vs Selenium 2026 Benchmarks (April 2026)
- Vervali Systems Selenium vs Playwright vs Cypress Comparison 2026
- ICST 2024 Industry Track ‘Cost of Flaky Tests in CI: An Industrial Case Study’
- StickyMinds The Hidden Costs of Flaky Tests (2025)
- Autonoma Research ‘Flaky Tests Consume 20% of CI Time’, April 2026
- Belitsoft Why is Playwright Better than Selenium in 2026 (March 2026)
- Alphabin Why Businesses Switch to Playwright Test Automation 2025
- GetPanto Selenium vs Playwright: QA Automation for 2026
- DEV Community 2025 Playwright Adoption Statistics & Market Share
- Datadog Flaky Tests: Hidden Costs and Mitigation (2024)
- BrowserStack Playwright vs Selenium Complete Guide
- TestDino Flaky Test Benchmark Report 2026
Ready to Quantify Your Automation ROI?
Axxonet helps SMEs and enterprise teams architect modern automation strategies that deliver measurable returns. Whether you are evaluating frameworks, planning a migration, or building from scratch, we bring the data and the expertise.
analytics@axxonet.net | analytics.axxonet.com