When to Use Grafana and How to Set Up Alerting in Grafana
Alerting now has become critical. As monitoring gives one an overview of the system, alerting is a near-real-time alert and notification system that immediately notifies the team regarding the occurrence of an issue in time to take some quick action before things go bad. For example, suppose a server uses more than its expected CPU usage. In that case, an alert will alert the team to address the matter before it leads to downtime or performance degradation. In short, alerting allows you to preclude problems that have a big impact on your system or business.
In this article, we will discuss the basic role of alerting in a monitoring system and exactly how alerting works inside Grafana, one of the powerful open-source tools for monitoring and visualization. After briefly discussing the importance of monitoring and alerting, we’ll guide you through the steps to set up alerting in Grafana.
Importance of Alerting in Monitoring Systems
Monitoring is the process of continuously collecting data from various parts of the system and understanding it over a while to trace patterns or anomalies. It helps in capacity planning, exhibits performance bottlenecks, and guides optimization efforts by showing a whole picture of health without initiating action. Instead of this, alerting is an active response mechanism that informs the teams when certain conditions or thresholds have been met; the objective being keeping the teams informed of problems as they occur.
Main Differences
Objectives: Monitoring is concerned with long-term data collection and analysis while alerting is directed at the immediate need for issue detection and response.
Timing: Monitoring is always on, capturing data at all times, while alerts are event-driven, which means they become effective only when certain conditions are met.
Key Benefits of Alerts
Continuous Monitoring Without Human Intervention: The alerts automate the process, ensuring that issues are flagged without constant human oversight.
Real-Time Update-Alerts: It is based on predefined conditions to send instant notifications and thus, ensure rapid responses to critical changes. The right people get notified and thus ensure proper escalations are managed.
Types of Alerts
Threshold-Based Alerts: Threshold-based alerts are identified based on definite thresholds, such as which could raise an alert when the CPU exceeds 90%.
Anomaly Detection Alerts: Intended to track and look for unusual patterns or behaviours that might not be detected using typical thresholds.
Event-Based Alerts: These alerts react to critical events, such as the failure of an application process or missing critical data; thus, teams are alerted to important occurrences.
Setting Up Alerting in Grafana (Step-by-Step Guide)
Prerequisites to Setup Alerts
Before you can have alerts working in Grafana, you need to have the environment set up just as outlined below:
Data Source Integration: You will need a data source integrated with Grafana; some examples of sources are Prometheus. Alerts work based on the time-series data retrieved from such sources.
Understanding Alert Rules: An alert rule is a query that checks the state of a defined metric and determines whether an alert should be triggered given certain predefined conditions.
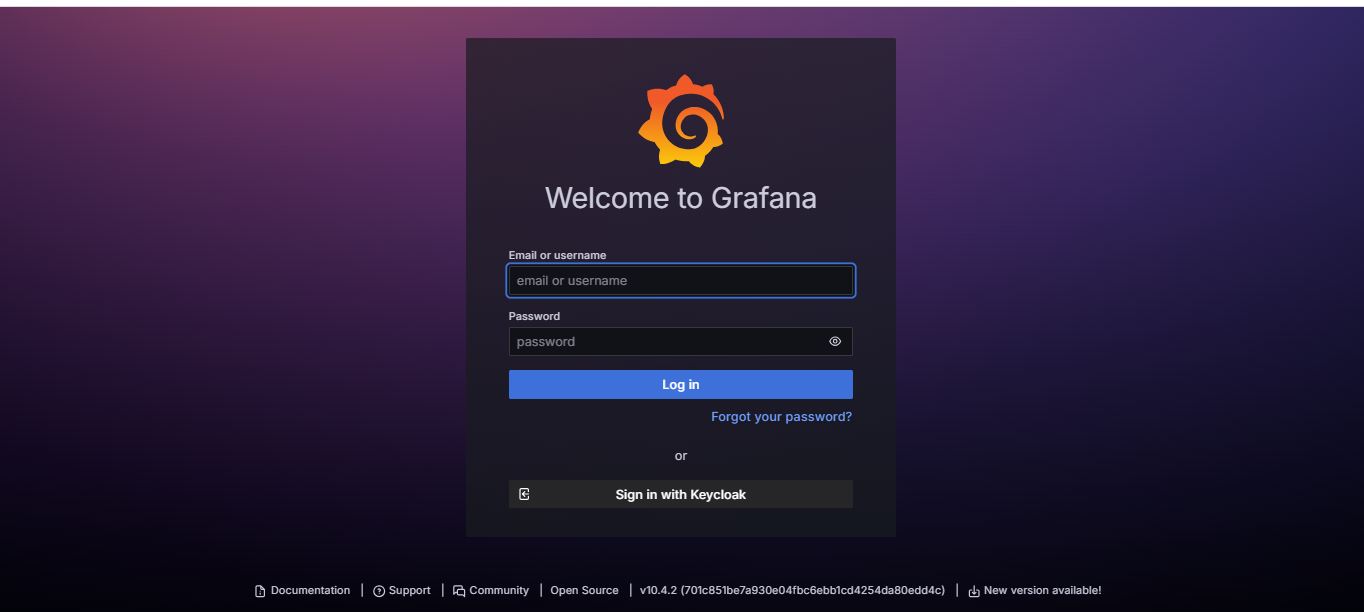
Step1: Login to Grafana with the required credentials
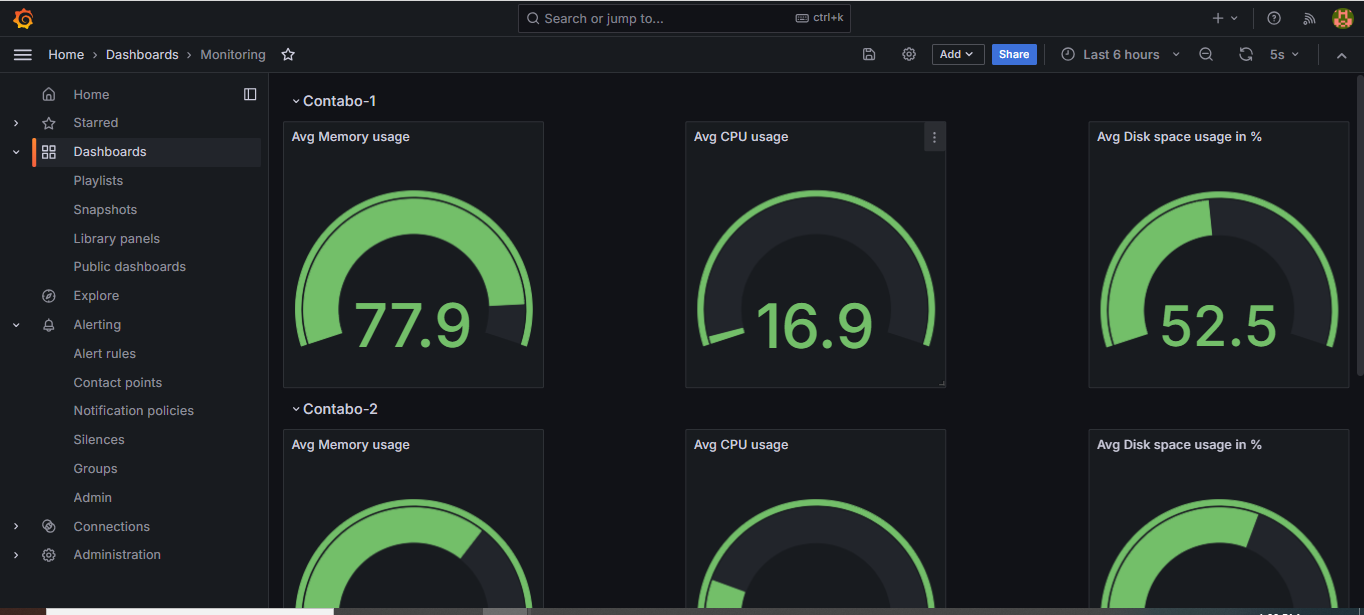
Step2: Create a new dashboard or open an existing dashboard where the notification alert needs to be setup
Steps to Create Alerts
Step 1: Create a Panel for Visualization
Add New Panel: First, add a new panel to your Grafana dashboard where you will visualize the metric that you are going to monitor.
Select Visualization Type: From the list, pick a visualization type that best fits either a Graph or Singlestat based on what sort of data you wish to monitor.
Step 2: Configure Alert
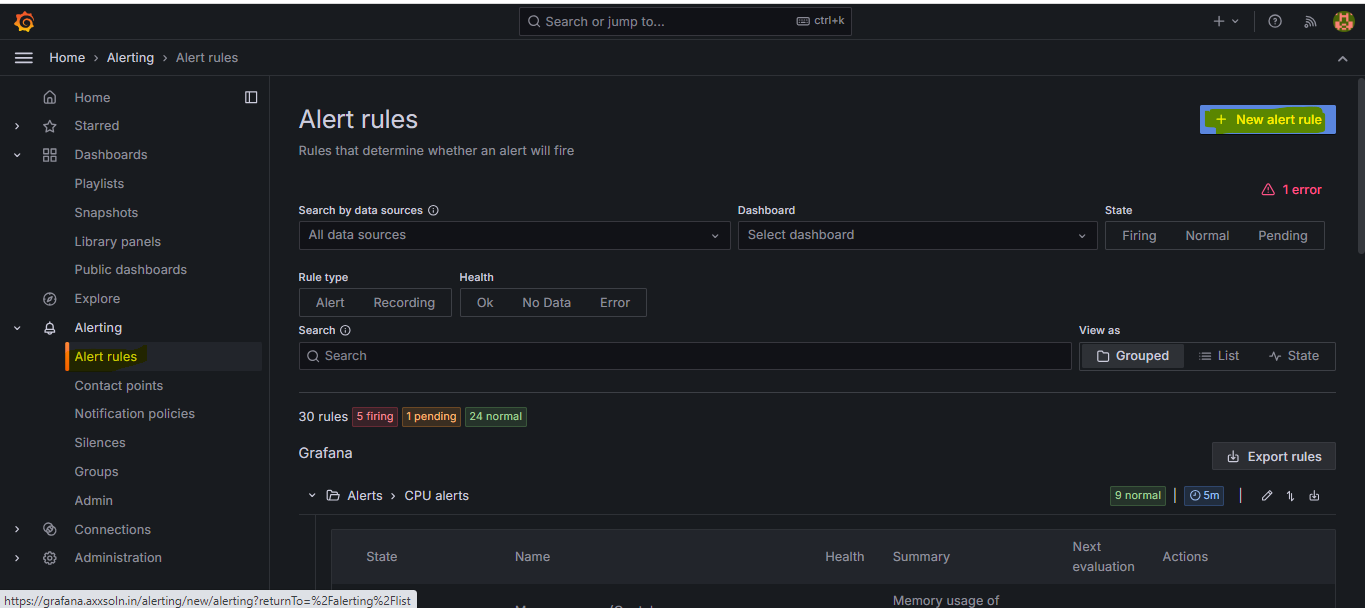
Alerting Menu Access: Navigate to the Alerting section from the menu.
New Alert Rule: From the subsection under Alerting, you click New Alert Rule to start the process of setting up an alert.
Data Source: Under the list of choices for a data source select such as Prometheus.
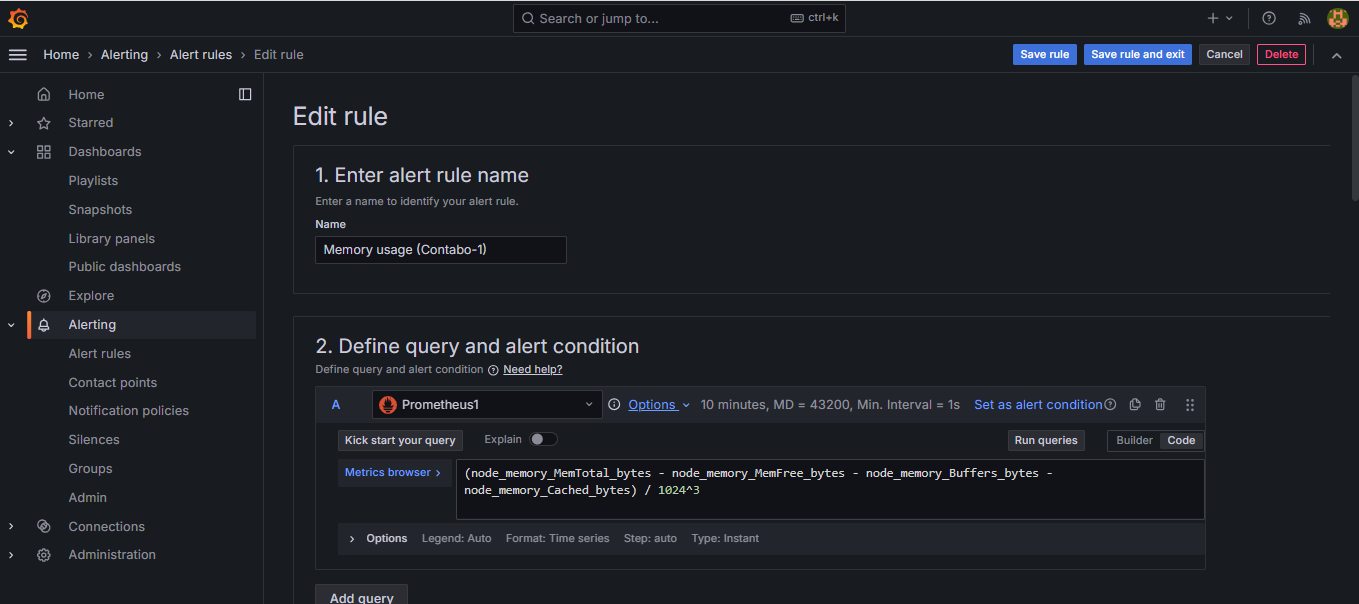
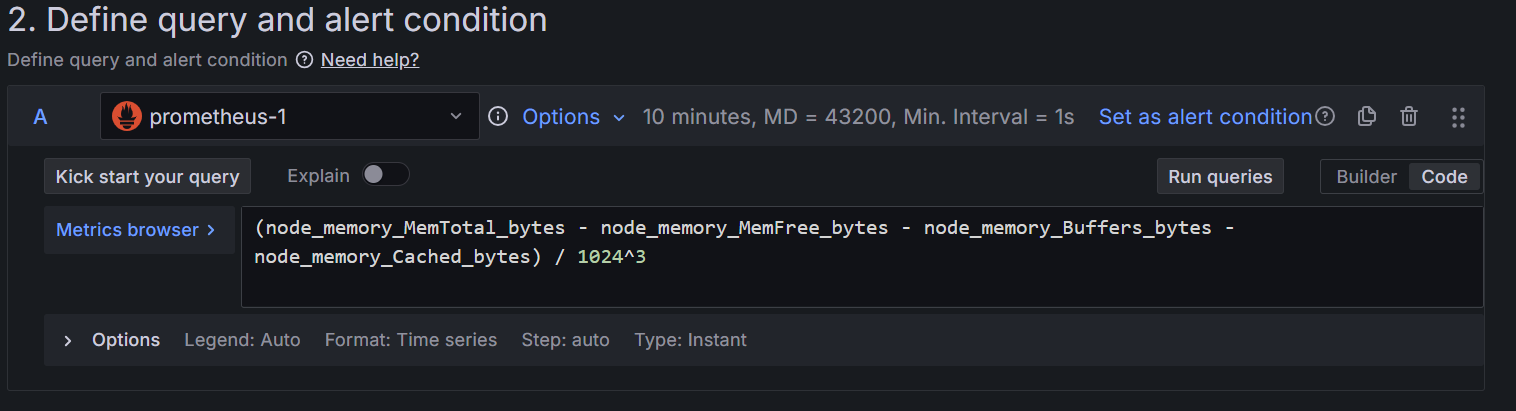
Write the Query: Type the query that fetches the metric you need to monitor. Be sure the query accurately reflects the condition you need to monitor.
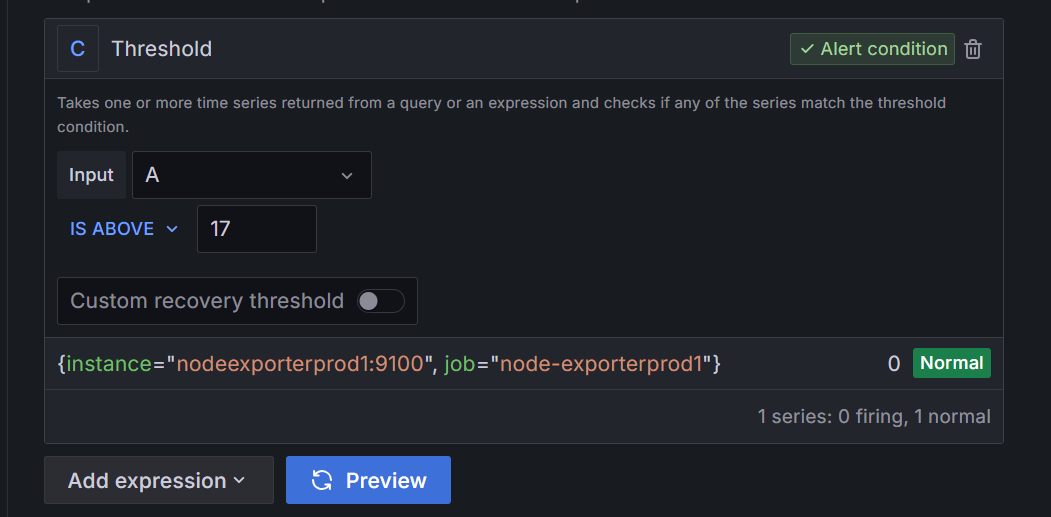
Set the Threshold: How to check the input, i.e. whether the value is above a certain value, or similar. You could choose this condition as “is above” with a threshold value (for example, 80 for CPU usage).
Enter Values for Alerting Rule Options
Name: Give the rule a descriptive name for the alert, like “High CPU Usage Alert”.
Alert Conditions: Define a query that specifies the conditions under which the alert should be triggered.
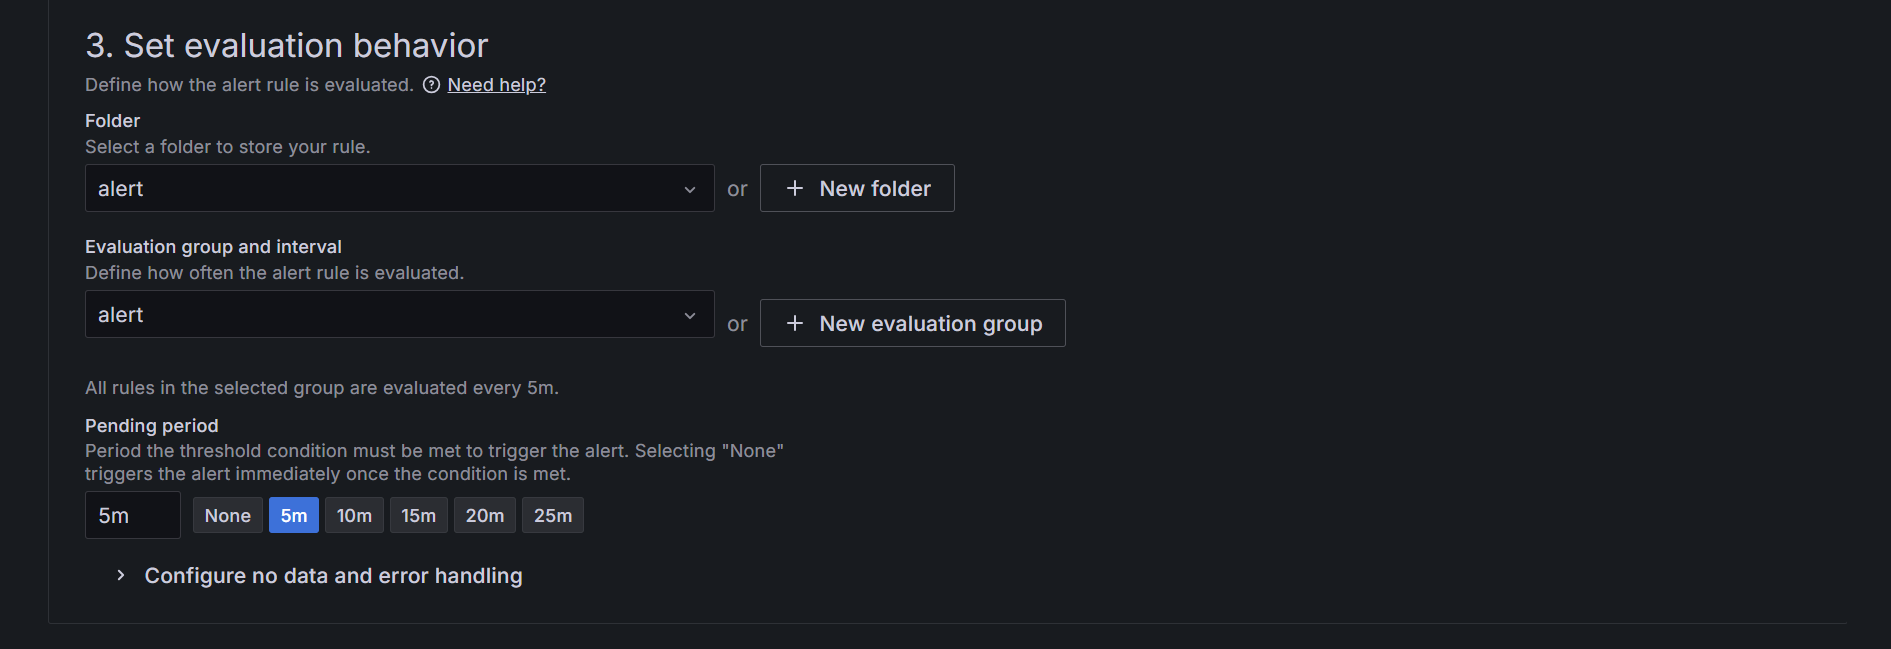
Alert Evaluation Behavior: Select how frequently to check the alert (in this case, every 5 minutes).
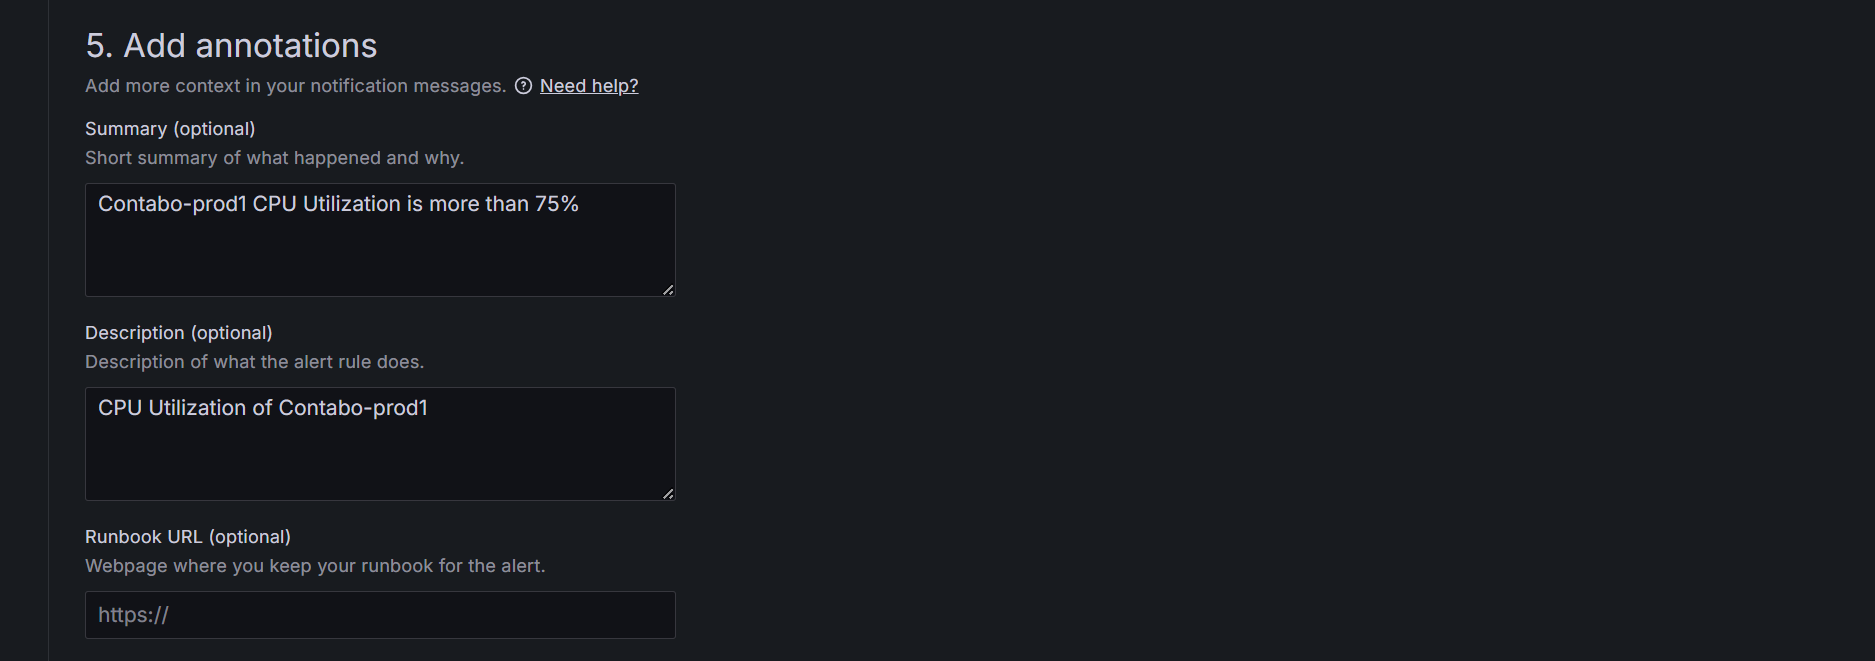
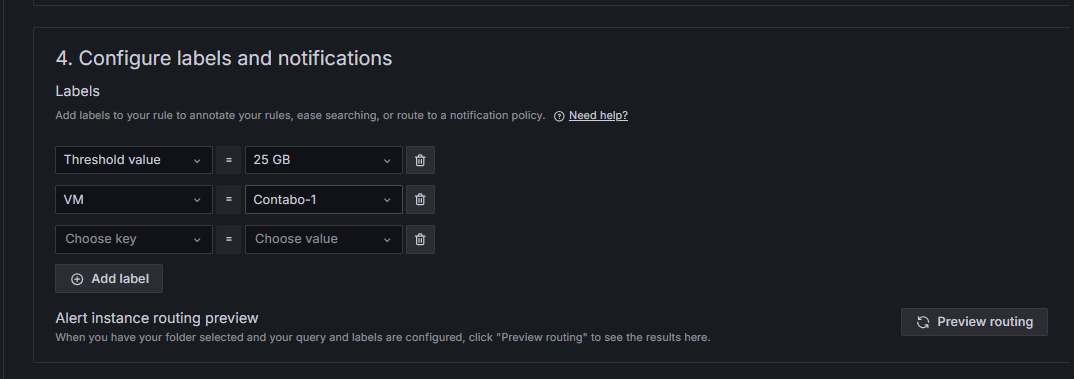
Labels and Notifications: Add relevant tags to help categorize your alerts, such as environment or service. Describe the action instructions for the alert message that will go out once the alert is triggered. Include some background information regarding the issue so it can be easily recognized.
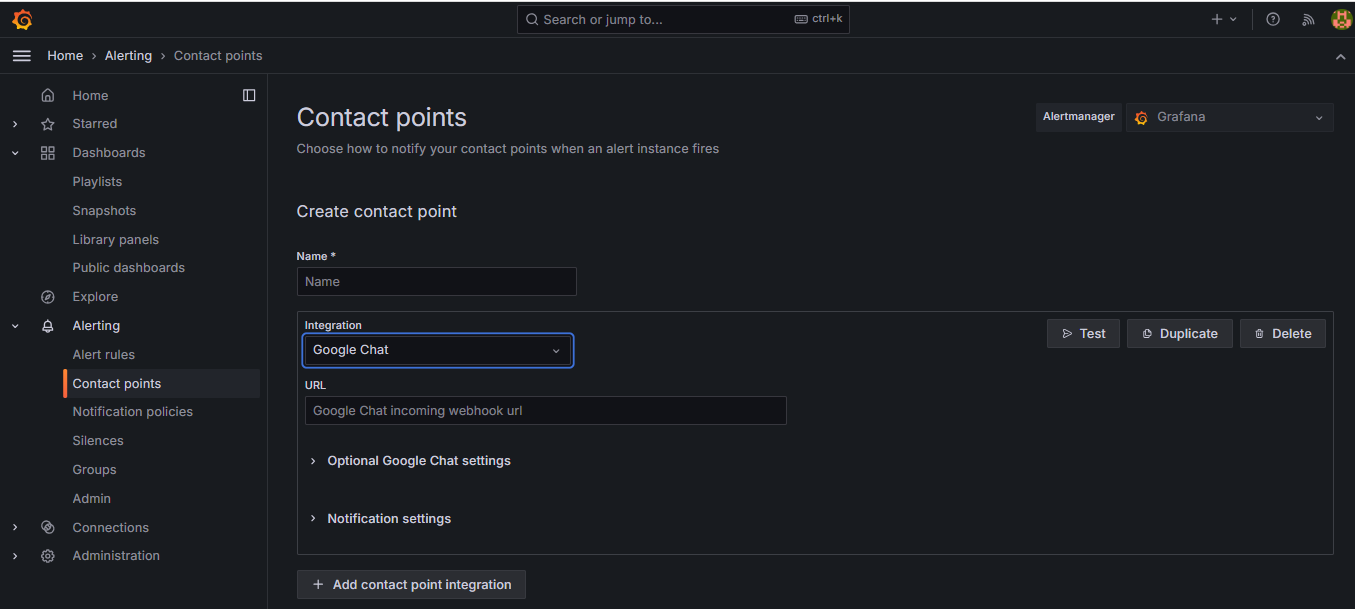
Include Contact Information: Determine the contact information where the alert notifications are to be delivered, such as email, Slack, or Google Chat/Hangout, PagerDuty & Webhooks. Remember, you’ll have to set up the notification channels in Grafana beforehand. In the URL section attach the Web hook of the above channels where you want to get notified.
Step 3: Testing your Alerts
Test the Alert: Use the testing feature in Grafana to test if your alert configuration is properly set. Thus, you will be reassured that under well-defined conditions, alerting works.

Step 4: Finalize the Alert
Save Alert: When all the settings for configuring are made, you can save the alert rule created by clicking Save.
Enable Alert: Finally, ensure to enable the alert so it can start monitoring for the defined conditions.
Conclusion
Alerting is one of the most important features of a modern monitoring system, that can enable teams to be able to respond to issues at their earliest sign rather than allowing them to spin out of control. With proper alert definitions integrated with monitoring, organizations can avoid more downtime, increase reliability, and make all these complex systems work flawlessly.
Alerts in Grafana must be actional and should not be vague. Avoid the over-complication of rules on alerts. Regularly update the alerts since the infrastructure and environments are always in the update, it has to be properly grouped and prioritized, and advance notification options like webhooks or third-party tools.
In this post, we focused on how Grafana excels at detailed alert settings and is suitable for monitoring metrics of the system, complementing tools like Uptime Kuma, which is good for simple service uptime tracking. In the following release, we dig deeper into Uptime Kuma, examining it in much more depth, then, of course, showing its setup from the ground up. Stay tuned to find out how these two tools can work together to create a seamless, holistic monitoring and alerting strategy.
Have questions about Grafana, alerting, or optimizing your monitoring setup? Our team is here to assist
Frequently Asked Questions (FAQs)
The purpose of configuring notification alerts is to ensure timely awareness of issues in your systems by monitoring specific metrics. Alerts allow you to proactively respond to potential problems, reducing downtime and enhancing system performance.
You can access Grafana by logging in with the required credentials. If you don't have an account, you'll need to create one or request access from your administrator.
You can set up alerts on both existing dashboards and new ones. Simply open the dashboard where you want to configure the alert or create a new dashboard if needed.
You can use various visualization types, such as Graph or Singlestat, depending on how you want to display the metric you're monitoring.
In the alerting section under "Rules," select "New Alert Rule" and choose your data source (e.g., Prometheus, InfluxDB) when writing the query to retrieve the metric you want to monitor.
You can define alert conditions by specifying when the alert should trigger based on your chosen metric. This could be when the metric crosses a certain threshold or remains above or below a specific value for a defined duration.
Setting a threshold value determines the specific point at which an alert will be triggered, allowing you to control when you are notified of potential issues based on the behaviour of the monitored metric.
Yes, you can customize the alert messages by setting annotations in the alerting rule. This allows you to tailor the content of the notification that will be sent when the alert is triggered.
You can set contact points for notifications, such as Email, Hangouts, Slack, PagerDuty, or Webhooks. Attach the webhook URL for the channel where you want to receive alerts.
Testing the alert with the "Test Rule" button allows you to simulate the alert and see how it would behave under current conditions, ensuring the configuration works as expected before saving.
Server monitoring involves tracking the performance and health of servers to ensure they are running efficiently and to quickly identify and resolve any issues. It is important because it helps prevent downtime, ensures optimal performance, and maintains the reliability of services.
Grafana provides real-time insights into server metrics such as CPU usage, memory utilization, network traffic, and disk activity. It offers customizable dashboards and visualization options to help interpret data and spot anomalies quickly.
Alerts are configured in Grafana with custom rules and thresholds. Integrating with Google Chat, the system sends immediate notifications to the relevant team members when any anomalies or performance issues arise.
Node-exporter and Prometheus are used for data collection. Node-exporter gathers system-level metrics, while Prometheus stores these metrics and provides querying capabilities.
Grafana can monitor a wide range of metrics, including CPU usage, memory utilization, disk I/O, network traffic, application response times, and custom application metrics defined through various data sources.
Yes, Grafana supports integration with numerous third-party applications and services, including notification channels like Slack, Microsoft Teams, PagerDuty, and more, enhancing its alerting capabilities.
The data collection frequency can vary based on the configuration of the data source (like Prometheus) and the specific queries you set up. You can typically configure scrape intervals in your Prometheus setup.
Yes, Grafana allows you to share dashboards with team members via direct links, snapshots, or by exporting them. You can also set permissions to control who can view or edit the dashboards.
If you encounter issues, check the Grafana logs for error messages, review your alert configurations, and ensure that your data sources are properly connected. The Grafana community and documentation are also valuable resources for troubleshooting.
Yes, Grafana allows you to create complex alert conditions based on multiple metrics using advanced queries. You can combine metrics in a single alert rule to monitor related conditions.
If a data source goes down, Grafana will typically show an error or a warning on the dashboard. Alerts configured with that data source may also fail to trigger until the connection is restored.
Yes, Grafana allows you to visualize historical data by querying data sources that store time-series data, such as Prometheus. You can create dashboards that analyze trends over time.
Annotations are markers added to graphs in Grafana to indicate significant events or changes. They can provide context for data trends and help identify when specific incidents occurred.
Alerts are conditions set to monitor specific metrics and trigger under certain circumstances, while notifications are the messages sent out when those alerts are triggered, informing users of the situation.
Yes, Grafana offers some customization options for its UI, including themes and layout adjustments. You can also configure dashboard variables to create dynamic and user-friendly interfaces.
Yes, you can use Grafana's API to programmatically create and manage dashboards, allowing for automation in scenarios such as CI/CD pipelines or large-scale deployments.
Grafana offers extensive documentation, tutorials, and community forums. Additionally, there are many online courses and video tutorials available to help users learn the platform.