
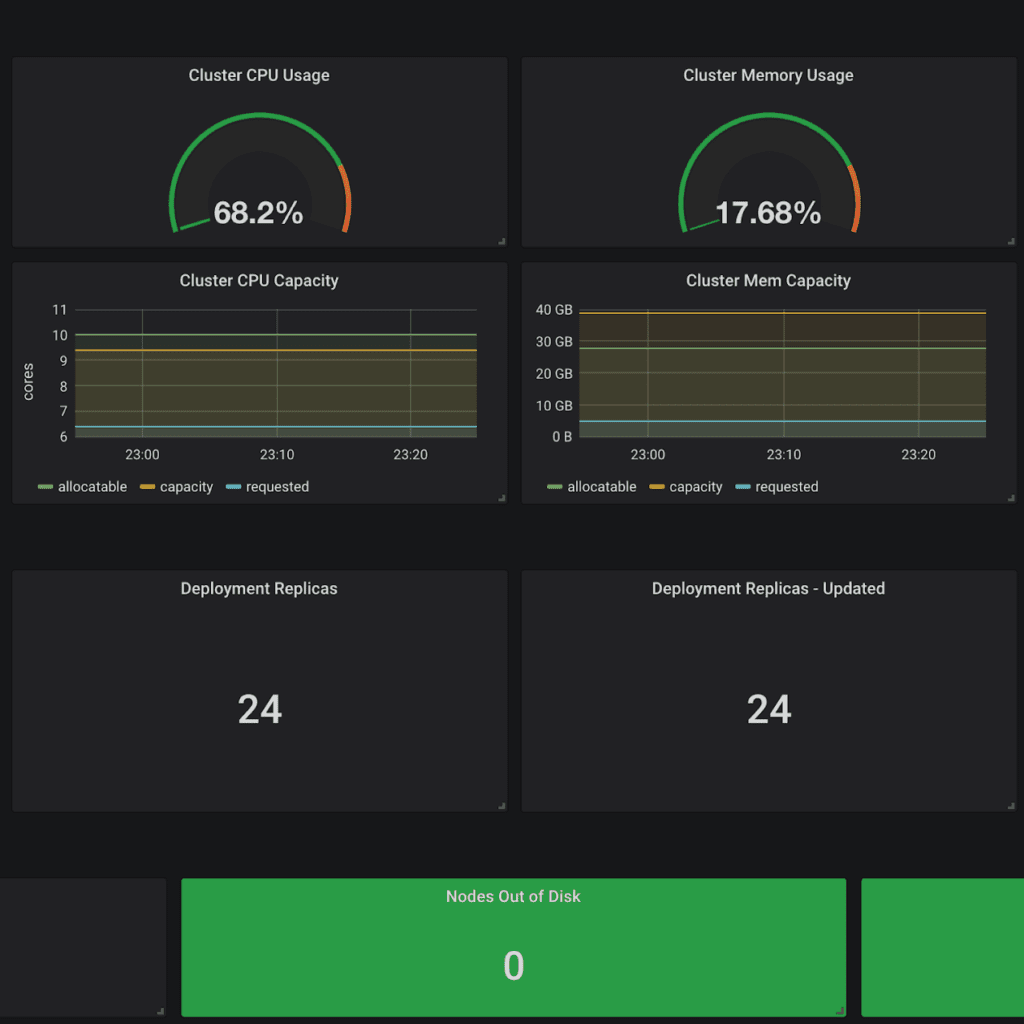
Grafana and Prometheus are some of the most common analytical tools used for monitoring and visualising the health of software applications. We can set the target of the Prometheus to collect data from targets that are monitored by scraping them from HTTP endpoints on these targets, while Grafana can be used to create the dashboards to visualise the data. These monitoring tools are widely used in DevOps to monitor various system and application resources utilization such as Storage, CPU, Memory, and Pods.
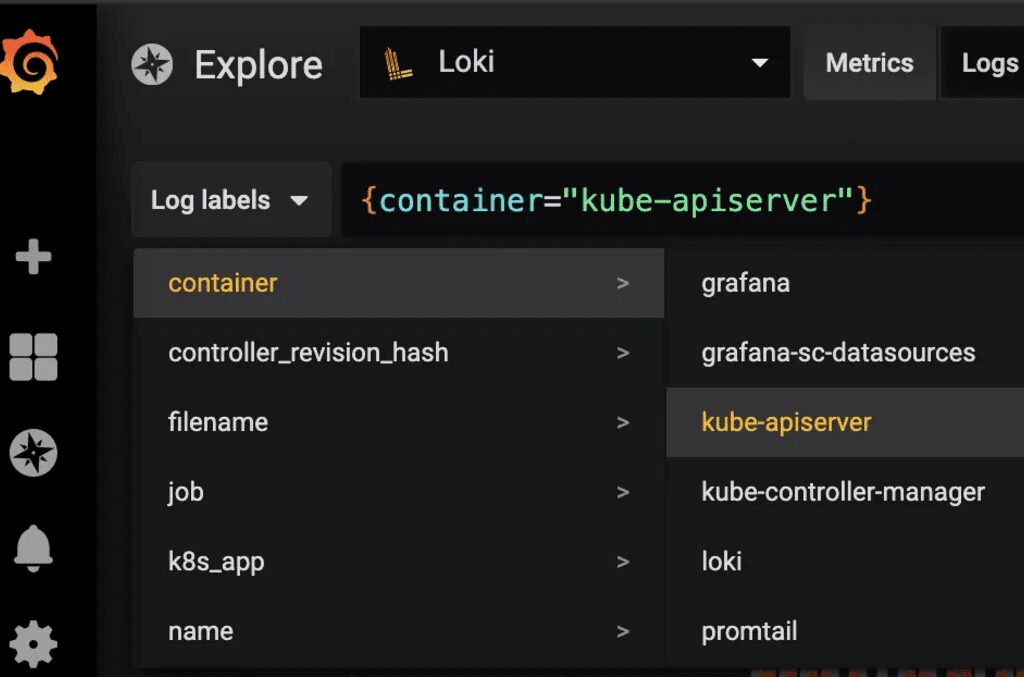
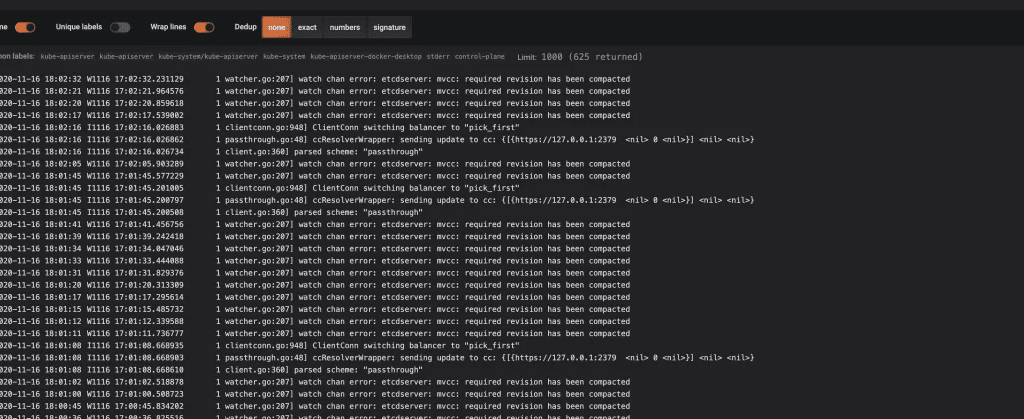
Loki is a new multi-tenant aggregation system in Grafana that collects data from access logs. It is a cost-effective and easy to operate module that labels each log stream rather than indexing the contents of the entire log.
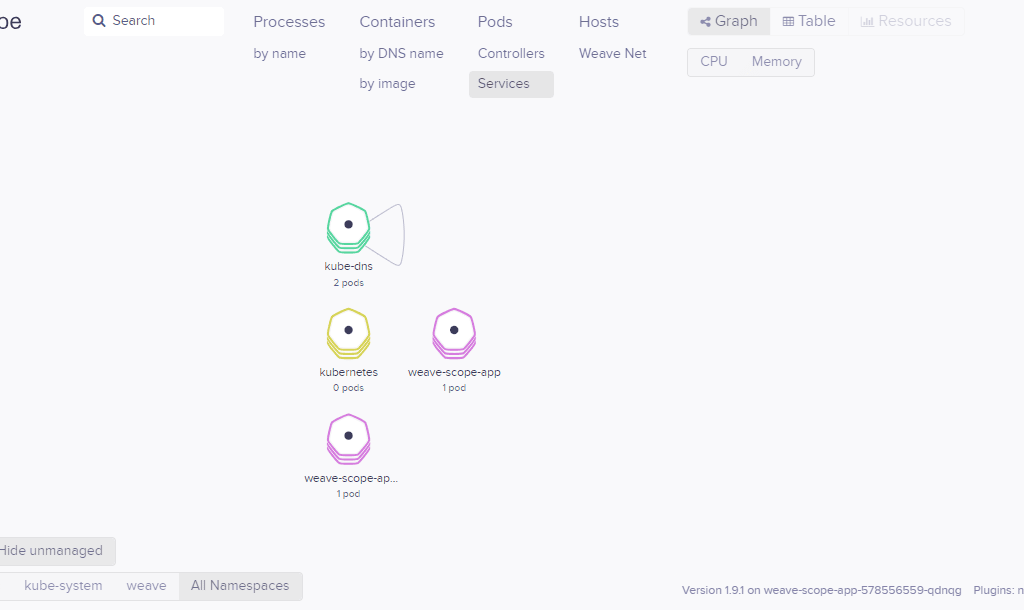
WeaveScope is another useful tool to visualise the network and troubleshoot CPU consumption and memory leaks. It provides a nice visual representation of the entire infrastructure including a top-down view of the application. It is very useful in diagnosing any problem in the distributed containerised applications.
Prerequisite for using the aforementioned tools
- We require a running Kubernetes cluster. Although it works well on any Kubernetes setup, we will nevertheless use a managed GKE cluster in this demo.
- If you are using a self-hosted installation, pre-install and configure the Kubernetes Metrics server on your cluster.
- Install Cloud SDK installer from Installing Google Cloud SDK | Cloud SDK Documentation.
- The user must be connected to a VPN while following the deployment procedure.
Overview of the Process
- Installation of helm if it not installed
- Adding chart/repository after the installation
- Setting Up and configuring Prometheus and Grafana
- Setting Up and configuring Loki
- Setting Up and configuring Weave Scope
Let’s get started!
Step 1 – Installation of the Helm
To install the helm, use the following commands.
- tar -xvf helm-v3.2.4-linux-amd64.tar.gz$ sudo mv linux-amd64/helm /usr/bin/
- sudo chmod +x /usr/bin/helm
- Helm version
The output you will get would look something like this –
version.BuildInfo{Version:“v3.2.1”, GitCommit:“fe51cd1e31e6a202cba7dead9552a6d418ded79a”, GitTreeState:“clean”, GoVersion:“go1.13.10”}
Step 2 – Adding Charts and Repositories
Once the Helm is setup, add the chart or repo as follows
- helm repo add stable https://charts.helm.sh/stable
Search for stable Prometheus or Grafana releases
- helm search repo stable | findstr Prometheus
- helm search repo stable | findstr grafana
- helm search repo stable | findstr weave-scope
Additionally, you can run the following command to install Prometheus Chart:
$ kubectl create ns monitoring
namespace/monitoring created
Step 3 – Setting Up and configuring Prometheus and Grafana.
To install and setup Prometheus and Grafana, follow the following commands
Prometheus with Grafana:
$ helm install Prometheus stable/Prometheus-operator –namespace monitoring
Prometheus without Grafana:
$ helm install prometheus stable/prometheus-operator –set grafana.enabled=false –namespace monitoring
$ kubectl –namespace monitoring get pods -l “release=prometheus”
To access Prometheus, the following commands will help you
$ kubectl port-forward -n monitoring Prometheus-Prometheus-Prometheus-oper-Prometheus-0 9090
Forwarding from 127.0.0.1:9090 -> 9090
To access the Grafana Dashboard (prometheus-grafana), run the command as mentioned below:
$ kubectl get pod -n monitoring|grep grafana (Linux)
OR
$ kubectl get pod -n monitoring|findstr grafana (Windows)
$ kubectl port-forward -n monitoring 3000
Forwarding from 127.0.0.1:3000 -> 3000
username: {username}
password: {password}
Step 4 – Setting up and configuring Loki
Here, we will install Loki with Helm
$ kubectl create namespace loki
$ helm repo add loki https://grafana.github.io/loki/charts
$ helm repo update
$ helm upgrade –install loki loki/loki-stack –namespace=loki –set grafana.enabled=true
$ kubectl get secret loki-grafana –namespace=loki -o jsonpath=”{.data.admin-password}” | base64 –decode ; echo
Note: We got some secret key, copied that as a Password for Loki Grafana
$ kubectl port-forward –namespace loki service/loki-grafana 3001:80
To access the Loki-Grafana Dashboard, you would require the mentioned login details:
username: admin
password: MAIpYOQjdb58jgyRaT0lFQb9Sm1h8HCBddScY5yo
Step 5 – Setting up and configuring Weave Scope.
We will install Weavescope using the Helm
$ kubectl create namespace tiller-world
$ kubectl create serviceaccount tiller –namespace tiller-world
We have to create 3 YAML files with the following name:
“role-tiller.yaml”
kind: Role
apiVersion: rbac.authorization.k8s.io/v1
metadata:
name: tiller-manager
namespace: tiller-world
rules:
– apiGroups: [“”, “batch”, “extensions”, “apps”]resources: [“*”]verbs: [“*”]
Further, run this command:
$ kubectl create -f role-tiller.yaml
“rolebinding-tiller.yaml”
kind: RoleBinding
apiVersion: rbac.authorization.k8s.io/v1
metadata:
name: tiller-binding
namespace: tiller-world
subjects:
– kind: ServiceAccount
name: tiller
namespace: tiller-world
roleRef:
kind: Role
name: tiller-manager
apiGroup: rbac.authorization.k8s.io
Lastly, run this command to get the final result:
$ kubectl create -f rolebinding-tiller.yaml
“clusterrolebinding.yaml”
kind: ClusterRoleBinding
apiVersion: rbac.authorization.k8s.io/v1
metadata:
name: weave-scope-bindings
subjects:
– kind: Group
name: system:serviceaccounts:tiller-world ##namespace
apiGroup: rbac.authorization.k8s.io
roleRef:
kind: ClusterRole
name: cluster-admin
apiGroup: rbac.authorization.k8s.io
Run this command:
$ kubectl create -f clusterrolebinding.yaml
To add a Stable weave-scope, the following command would come in handy:
$ helm repo add stable https://charts.helm.sh/stable
Further, to install stable weave-scope:
$ helm install tiller-world stable/weave-scope –namespace=tiller-world –set rbac.create=true
Additional specification to look out for
➔ To start the tiller-world service:
$ kubectl get svc -n tiller-world
NAME TYPE CLUSTER-IP EXTERNAL-IP PORT(S) AGE
tiller-world-weave-scope ClusterIP 10.112.6.104 <none> 80/TCP 28s
➔ To access Weave Scope:
$ kubectl port-forward -n tiller-world svc/tiller-world-weave-scope 4040:80
Lastly, if you were ever to uninstall weave-scope, the following command should do the trick
$ helm uninstall tiller-world stable/weave-scope –namespace=tiller-world
$ kubectl delete -f role-tiller.yaml
$ kubectl delete -f rolebinding-tiller.yaml
$ kubectl delete -f clusterrolebinding.yaml
$ kubectl get namespaces
$ kubectl delete namespace <namespace-name>
The commands mentioned above should be enough to start with Prometheus and Grafana and guide you in the right direction.
All the best! Connect with us here.