
In the world of software development, ensuring the performance and reliability of applications is paramount. One of the most popular tools for performance testing is Apache JMeter, known for its flexibility and scalability. Meanwhile, Jenkins has become the go-to choice for continuous integration and continuous delivery (CI/CD). Combining the power of JMeter with the automation capabilities of Jenkins can significantly enhance the efficiency of performance testing within the development pipeline. In this article, we’ll explore the integration of JMeter with Jenkins and how it can streamline the performance testing process.

Apache Jmeter
Apache JMeter is a powerful open-source tool designed for load testing, performance testing, and functional testing of applications. It provides a user-friendly GUI that allows testers to create and execute several types of tests, including HTTP, FTP, JDBC, LDAP, and more. JMeter supports simulating heavy loads on servers, analyzing overall performance metrics, and finding performance bottlenecks.
With its scripting and parameterization capabilities, JMeter offers flexibility and scalability for testing web applications, APIs, databases, and other software systems. Its extensive reporting features help teams assess application performance under different conditions, making it an essential tool for ensuring the reliability and scalability of software applications. More information available here Apache JMeter.
Jenkins
Jenkins is one of the most popular open-source automation servers widely used for continuous integration (CI) and continuous delivery (CD) processes in software development for several years now. It allows developers to automate the building, testing, and deployment of applications, thereby streamlining the development lifecycle. Jenkins supports integration with various version control systems like Git, SVN, and Mercurial, enabling automatic triggers for builds whenever code changes are pushed.
Its extensive plugin ecosystem provides flexibility to integrate with a wide range of tools and technologies, making it a versatile solution for managing complex CI/CD pipelines. Jenkins’ intuitive web interface, extensive plugin library, and robust scalability make it a popular choice for teams aiming to achieve efficient and automated software delivery processes. The Jenkins docs has a page to help with the Jenkins installation process.
Why Integrate JMeter with Jenkins?
Traditionally, performance testing has been a manual and time-consuming process, often conducted as a separate part of the development lifecycle by test teams. The results had to then be shared with the rest of the team as there was no automated execution or capturing of the test results as part of the CICD pipeline. However, in today’s fast-paced software development environment, there’s a growing need to automate the complete testing processes to include execution of Performance tests as part of the CICD pipeline. By integrating JMeter with Jenkins, organizations can achieve the following benefits:
Automation: Jenkins allows you to automate the execution of JMeter tests as part of your CI/CD pipeline, enabling frequent and consistent performance testing with minimal manual intervention.
Continuous Feedback: Incorporating performance tests into Jenkins pipelines provides immediate feedback on the impact of code changes on application performance, allowing developers to find and address performance issues early in the development cycle.
Reporting: Jenkins provides robust reporting and visualization capabilities, allowing teams to analyze test results and track performance trends over time, helping data-driven decision-making.
Our Proposed Approach & its advantages
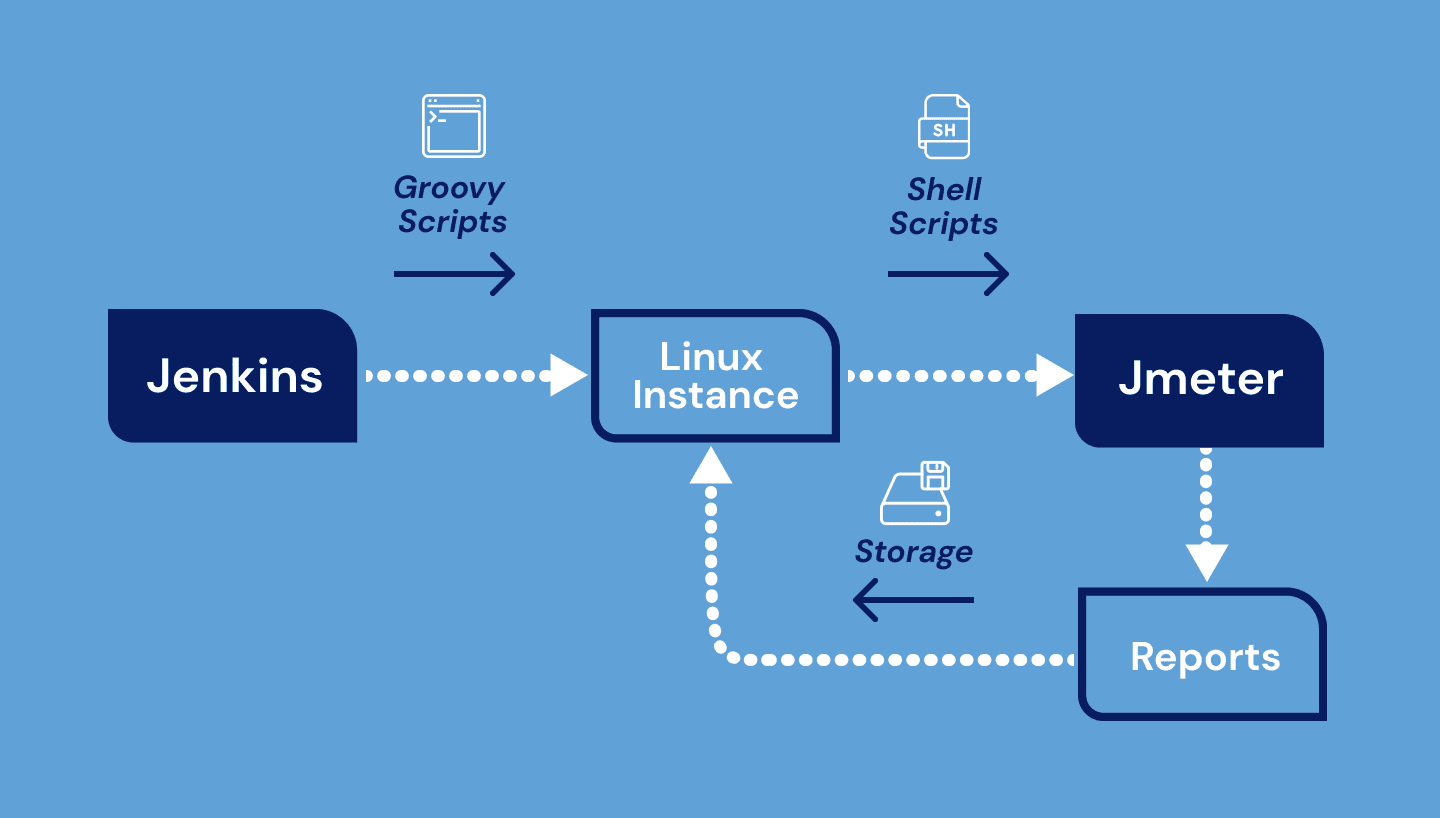
We’ve adopted a new approach in addition to using the existing JMeter plugin for Jenkins wherein we enhance the Jenkins Pipeline to include detailed notifications and better result organization.
The key steps of our approach are as follows.
- We can install JMeter directly on the agent base OS. This ensures we have access to the latest features and updates.
- We use the powerful Blaze Meter plugin to generate our JMeter scripts.
- We’ve written a dedicated Jenkins pipeline to automate the execution of these Jmeter scripts.
- We have also defined the steps as part of the Jenkins script to distribute the Execution Status and log by email to chosen users.
- We also store the results in a configurable Path for future reference.
All of this ensures better automation, flexibility or control of the execution, notification and efficient performance testing as part of the CICD Pipeline.
Setting Up Blaze Meter & Capturing the Test Scripts
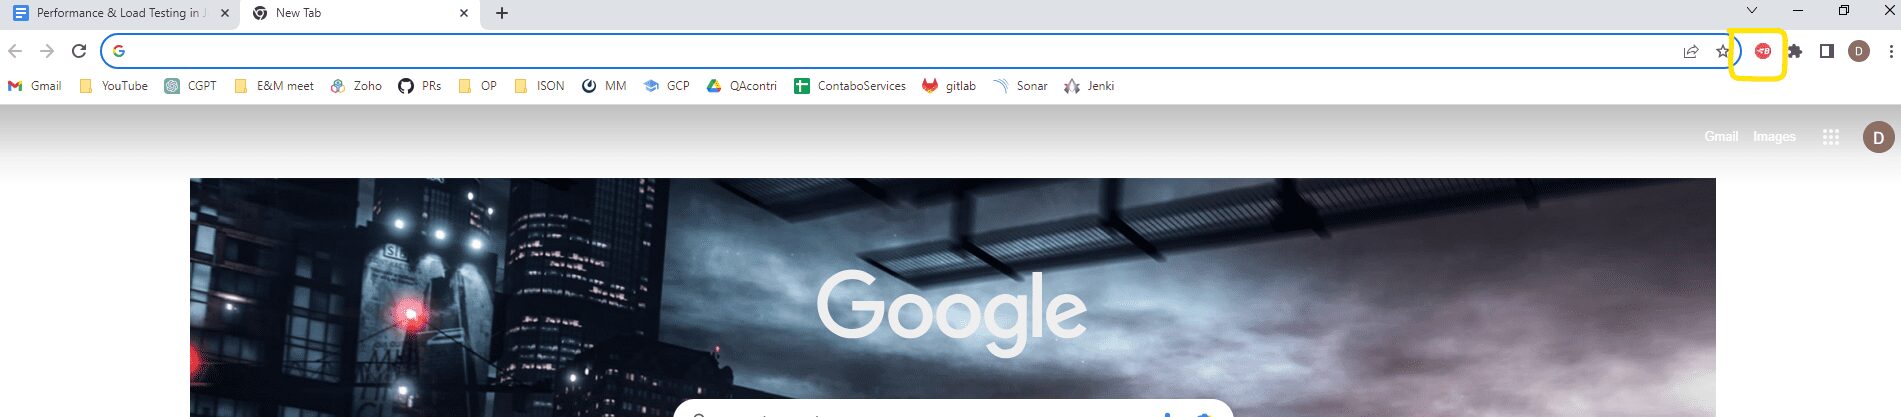
To automate the process of script writing we should use the Blaze Meter tool. Navigate to chrome extensions and search for Blaze Meter. Click on add to chrome. Access Blaze Meter official website and create an account there for further process.
Open chrome and now you can find the Blaze Meter extension on the top right corner.
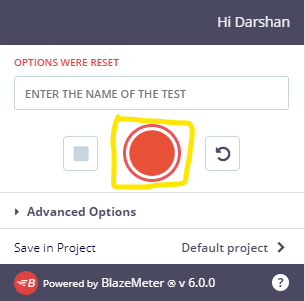
Click on the Blaze Meter chrome extension. A toolbox will be visible. Open the application where you want to record the scripts for Jmeter. Click on the record button to start.
Navigate through the application and perform necessary operations as end users of the application would. Click on the stop button to stop the recording.
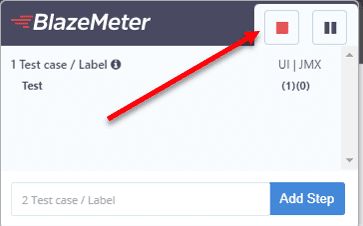
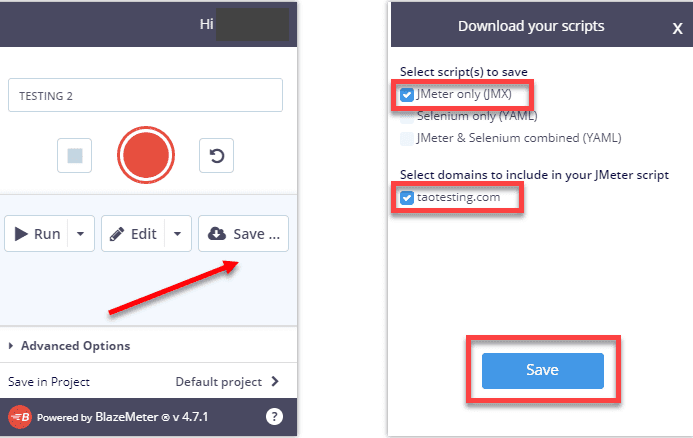
Now Blaze Meter has recorded the scripts. To save it in. jmx format, click on save, check the Jmeter only box and click on save as shown in the screenshot below.
For more information on how to record a Jmeter script using Blaze Meter, follow the link
Modifying the Test Scripts in JMeter
The recorded script can then be opened in JMeter, and necessary changes can be made as per the different Load and Performance Scenarios to be assessed for the application.
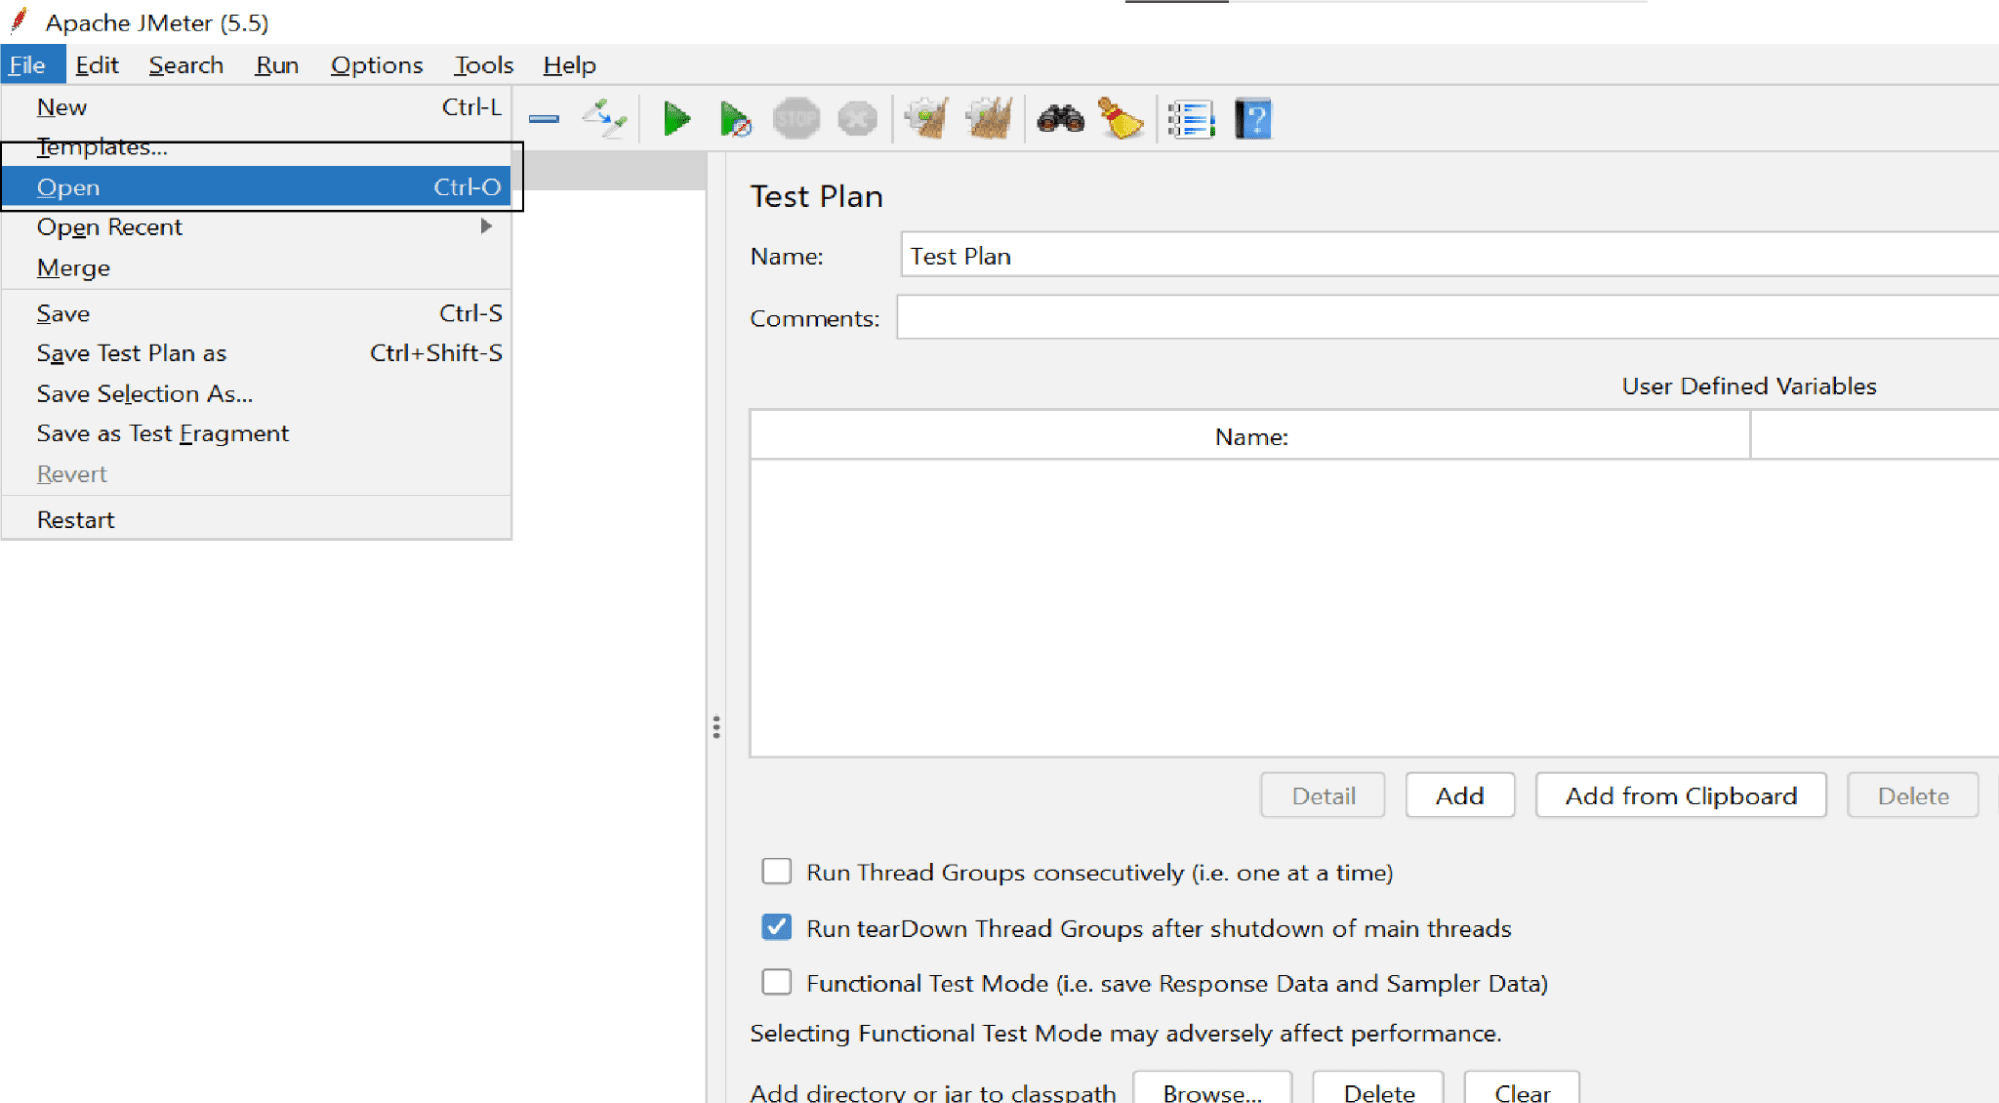
Select the generated .jmx file and click on open
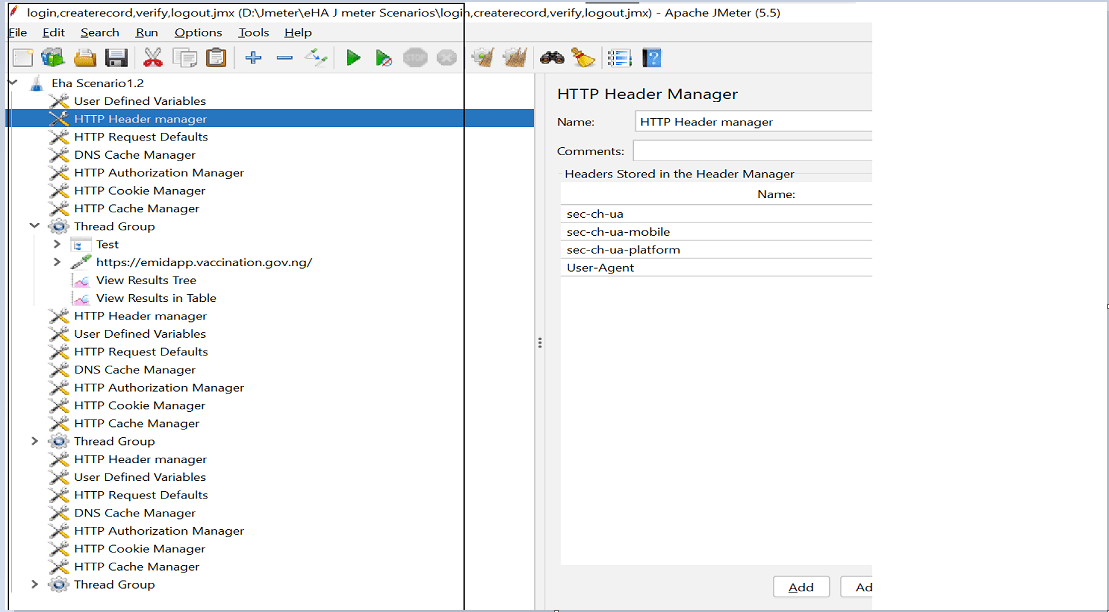
In addition to these you can add listeners to the thread groups, for better visibility of each sample results.
Setting up a Jenkins pipeline to execute JMeter tests
Install Jenkins: If you haven’t already, install Jenkins on your server following the official documentation.
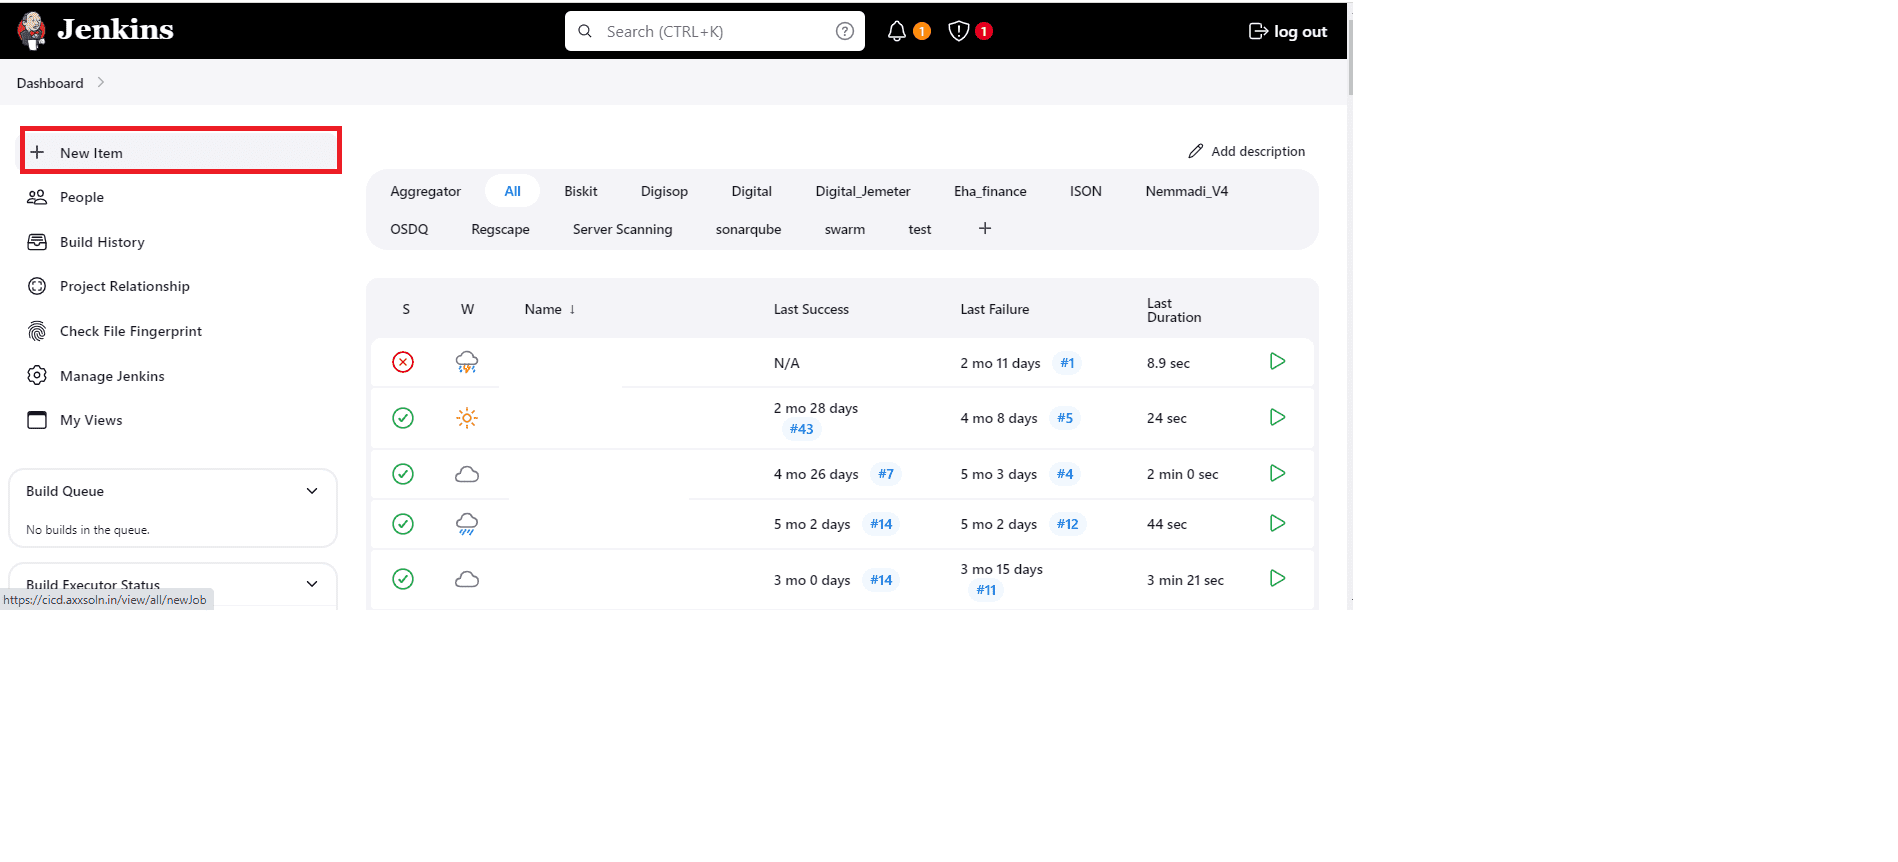
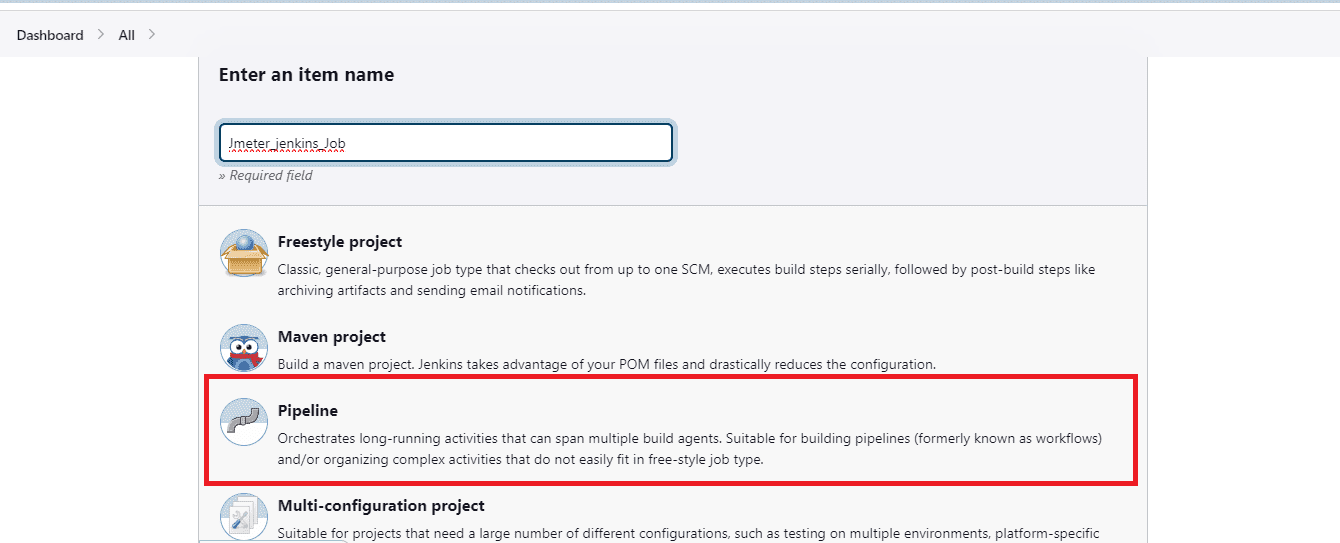
Create a New Pipeline Job: A new pipeline job should be created to orchestrate the performance testing process. Click on new item to create a pipeline job and select pipeline option.
Post creating a new pipeline, navigate to configure and mention the scheduled time in the below format.
(‘H 0 */3 * *’)
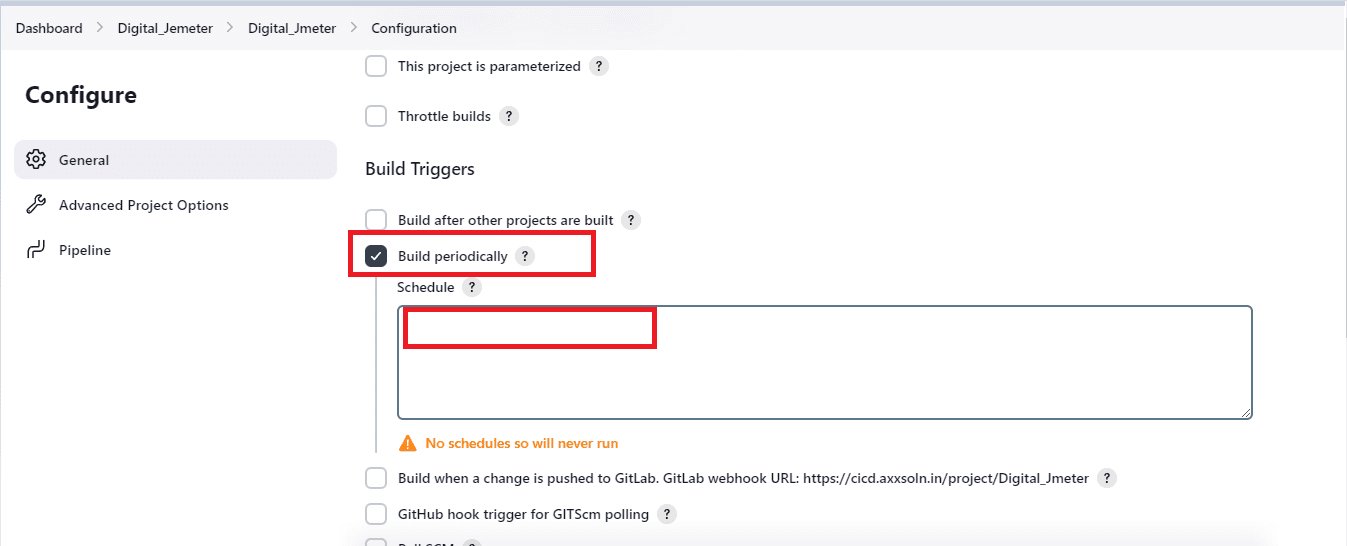
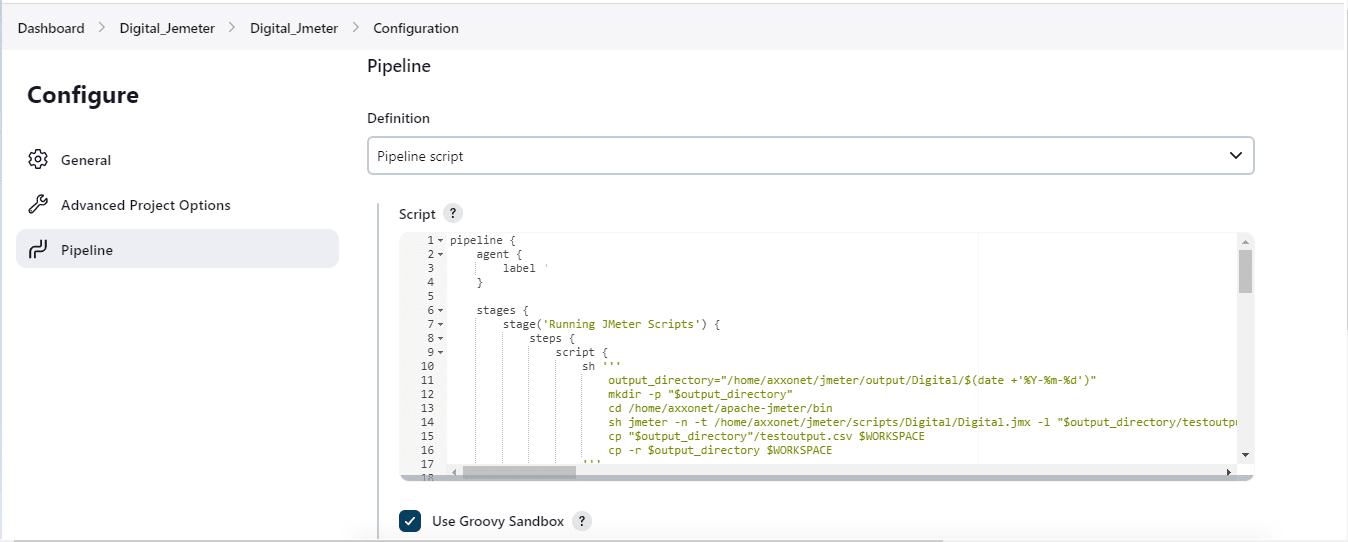
Define Pipeline Script: Configure the pipeline script to execute the JMeter test at regular intervals using a cron expression.
pipeline {
agent {
label ‘{agent name}’
}
This part of the Jenkins pipeline script specifies the agent (or node) where the pipeline should run. The label ‘{agent name}’ should be replaced with the label of the specific agent you want to use. This ensures that the pipeline will execute on a machine that matches the provided label.
stages {
stage(‘Running JMeter Scripts’) {
steps {
script {
sh ”’
output_directory=”{path}/$(date +’%Y-%m-%d’)”
mkdir -p “$output_directory”
cd {Jmeter Path}/bin
sh jmeter -n -t {Jmeter Script Path} -l “$output_directory/{Result file name}” -e -o “$output_directory”
cp “$output_directory”/{Result file name} $WORKSPACE
cp -r $output_directory $WORKSPACE
”’
}
}
}
This stage named ‘Running JMeter Scripts’ has steps to execute a shell script. The script does the following:
1. Creates an output directory with the current date.
2. Navigates to the JMeter binary directory.
3. Runs the JMeter test script specified by {Jmeter Script Path}, storing the results in the created directory
4. Copies the result file and output directory to the Jenkins workspace for archiving.
post {
always {
script {
currentBuild.result = currentBuild.result
def date = sh(script: ‘date +\’%Y-%m-%d\”, returnStdout: true).trim()
def subject = “${currentBuild.result}: Job ‘${env.JOB_NAME}'”
def buildLog = currentBuild.rawBuild.getLog(1000)
emailext(
subject: subject,
body: “”” Hi Team , Jmeter build was successful , please contact team for the results “””,
mimeType: ‘text/html’,
to: ‘{Receiver Email}’,
from: ‘{Sender Email}’,
attachLog: true ,
)
}
}
This post block runs after the pipeline completes. It retrieves the last 1000 lines of the build log and sends an email notification with the build result, a message, and the build log attached to specified recipients.
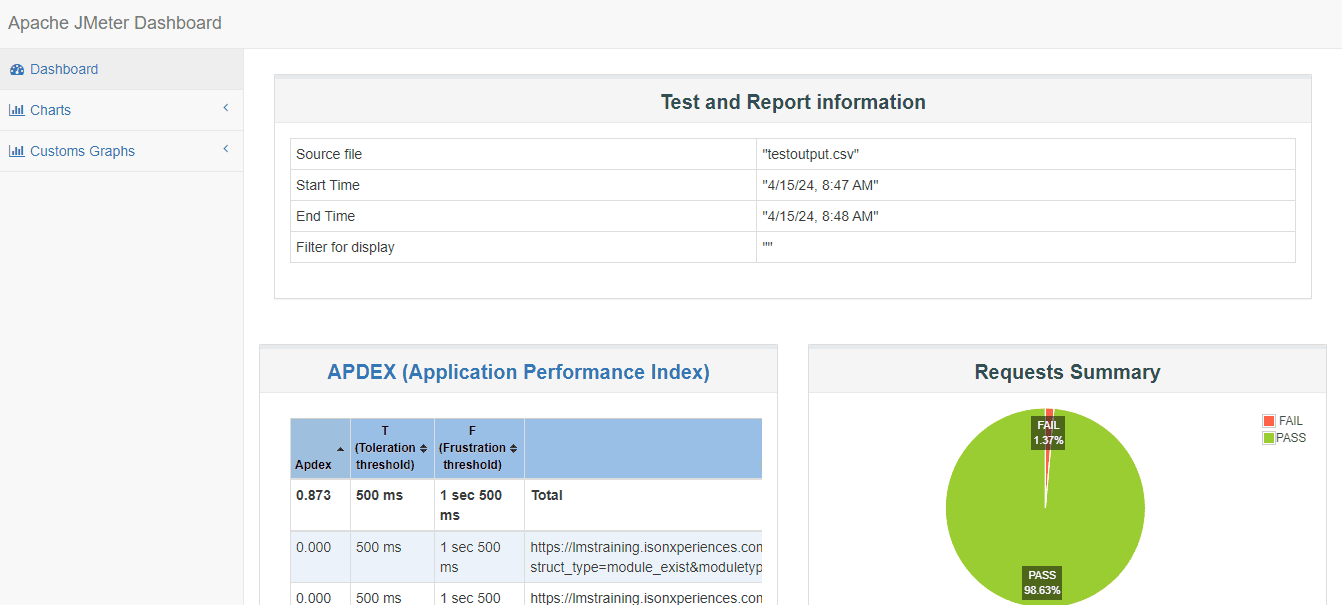
View the generated reports.
In Linux instance navigate to the path where the .html files are stored i.e. the output report of the jmeter scripts
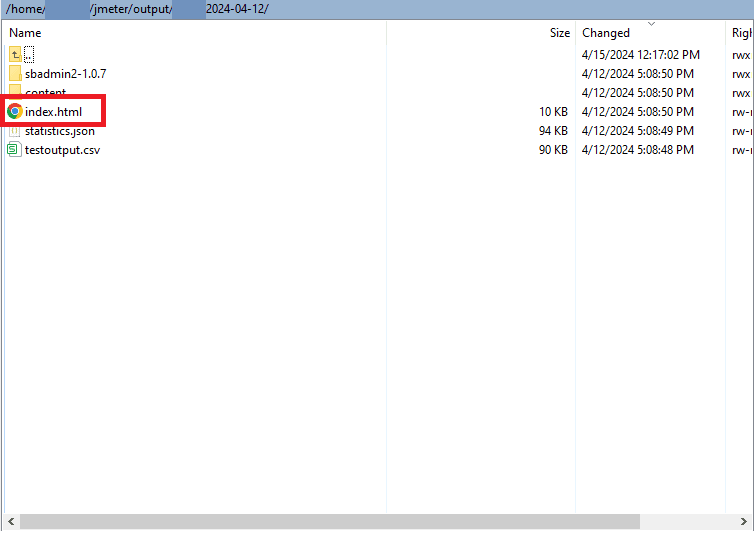
Before you open the HTML file, move the complete folder to your local device. Once the folder is moved open the .html file and you’ll be able to analyze the reports
Conclusion
By following the steps described and the approach suggested, we have shown how Integrating JMeter with Jenkins enables teams to automate performance testing and incorporate it seamlessly into the CI/CD pipeline. By scheduling periodic tests, storing results, and sending out email notifications, organizations can ensure the reliability and scalability of their applications with minimal manual intervention. Embrace the power of automation and elevate your performance testing efforts with Jenkins and JMeter integration. For any assistance in automation of your Performance tests please get in touch with us at analytics@axxonet.net or leave us a note at form and we will get in touch with you.
Frequently Asked Questions (FAQs)
You can download the latest version from the Apache JMeter homepage, after download extract the downloaded files to a directory on the agent machine and Make sure to add the JMeter bin directory in the system's PATH variable so that all JMeter commands can be run from the command line.
Its a Chrome extension that helps users to record and create JMeter scripts easily. To use it, install the BlazeMeter extension from the Chrome Web Store and record the desired scenarios on your web application, and export the recorded script in .jmx format. This script can then be modified in JMeter and used in your Jenkins pipeline for automated performance testing.
Create a new pipeline job in Jenkins and define the pipeline script to include stages for running JMeter tests. The script should include steps to execute JMeter commands, store the results, and send notifications. Here's a example script for you
pipeline {
agent { label 'your-agent-label'
}
stages {
stage('Run JMeter Tests') {
steps {
script {
sh '''
output_directory="/path/to/output/$(date +'%Y-%m-%d')"
mkdir -p "$output_directory"
cd /path/to/jmeter/bin
sh jmeter -n -t /path/to/test/script.jmx -l "$output_directory/results.jtl" -e -o "$output_directory"
cp "$output_directory/results.jtl" $WORKSPACE
cp -r "$output_directory" $WORKSPACE
'''
}
}
}
}
post {
always {
emailext (
subject: "JMeter Test Results",
body: "The JMeter tests have completed. Please find the results attached.",
recipientProviders: [[$class: 'DevelopersRecipientProvider']],
attachLog: true
)
}
}
}
You can schedule the JMeter test execution using the cron syntax in the Jenkins pipeline configuration. For example, to run the tests every three hours, you can use:<br><br>
H 0 */3 * * *
<br><br>
This will trigger the pipeline at the top of the hour every three hours.
After the JMeter tests are executed, the results are typically stored in a specified directory on the Jenkins agent. You can navigate to this directory, download the results to your local machine, and open the HTML reports generated by JMeter for detailed analysis.