In today’s fast-moving business landscape, leaders need more than static reports — they need the ability to explore multiple business scenarios instantly. Whether it’s evaluating pricing strategies, forecasting operational costs, or measuring profitability under different assumptions, What-If Analysis has become an essential capability for modern enterprises.
At Axxonet, we leverage advanced Python-based tools like Streamlit to build interactive What-If dashboards that allow businesses to simulate outcomes in real time and make data-driven decisions with confidence.
What Is What-If Analysis?
What-If Analysis is a decision-support technique that helps organizations understand how changes in key inputs — such as revenue, unit cost, volume, or operational parameters — impact key metrics like profitability, efficiency, or ROI.
Traditional methods rely heavily on Excel or BI tools. While effective, these approaches are often:
- Manual and time-consuming
- Difficult to scale
- Prone to formula errors
- Dependent on licensed software
- Limited in automation and real-time data connectivity
Interactive web-based tools overcome these limitations by making scenario exploration intuitive, visual, and real time.
Why Streamlit?
Streamlit provides a powerful yet simple framework to build secure, interactive, analytical applications without front-end development. We use Streamlit because:
- Open-Source & Free
- No licensing restrictions, unlike Excel or proprietary BI tools.
- Extremely Fast Development
- Widgets, charts, layouts, and logic can be built in minutes using pure Python.
- Real-Time Interaction
- Any parameter change triggers instant recalculation and updates on the screen.
- Easy Integration With Databases
Streamlit connects effortlessly with:
- PostgreSQL
- MySQL
- ClickHouse
- Azure SQL
- REST APIs
- Any operational data source
This enables What-If dashboards to pull live, monthly-updating operational averages directly from backend systems.
- Automation & Scalability
Streamlit apps can:
- Auto-refresh values
- Run simulations at scale
- Support multiple teams at once
- Be embedded inside internal systems
- Ease of Deployment
Runs on:
- Local machine
- Docker container
- Cloud (AWS, Azure, GCP)
- Streamlit Community Cloud
- Enterprise servers
7. Built-in Support for Charts, KPIs, and PDF Exports
- Interactive dashboards and exportable insights make decision-making seamless.
Why Companies Need Interactive What-If Tools
- Instant Scenario Simulation
- Decision-makers can adjust parameters on the fly and instantly see how results change considering live data from operational systems.
- Better Visibility for Strategic Planning
- Dynamic dashboards help compare multiple business scenarios, enabling more informed choices.
- Reduction of Manual Work
- Automated recalculation eliminates time-consuming spreadsheet operations where data needs to be extracted from multiple sources and compiled in sheets, which not only takes time but can also lead to errors when copying the data across multiple sources.
- Improved Collaboration
- Teams across finance, logistics, or operations can access the same interactive tool via a browser using real time information.
How We Use Streamlit to Build What-If Dashboards
Streamlit provides an elegant framework for building data apps without front-end development.
At Axxonet, we extend Streamlit to create:
- Clean and interactive user interfaces
- Dynamic input controls for cost, revenue, and operational parameters
- Real-time Key Metrics updates
- Visual charts and insights for faster comprehension
- Downloadable PDF summaries for easy sharing
The result is a seamless, responsive experience where any input change automatically updates the output metrics and visualisations, considering the real-time live backend database information.
Profitability Simulation Dashboard
Below is a conceptual example of the type of dashboard we build:
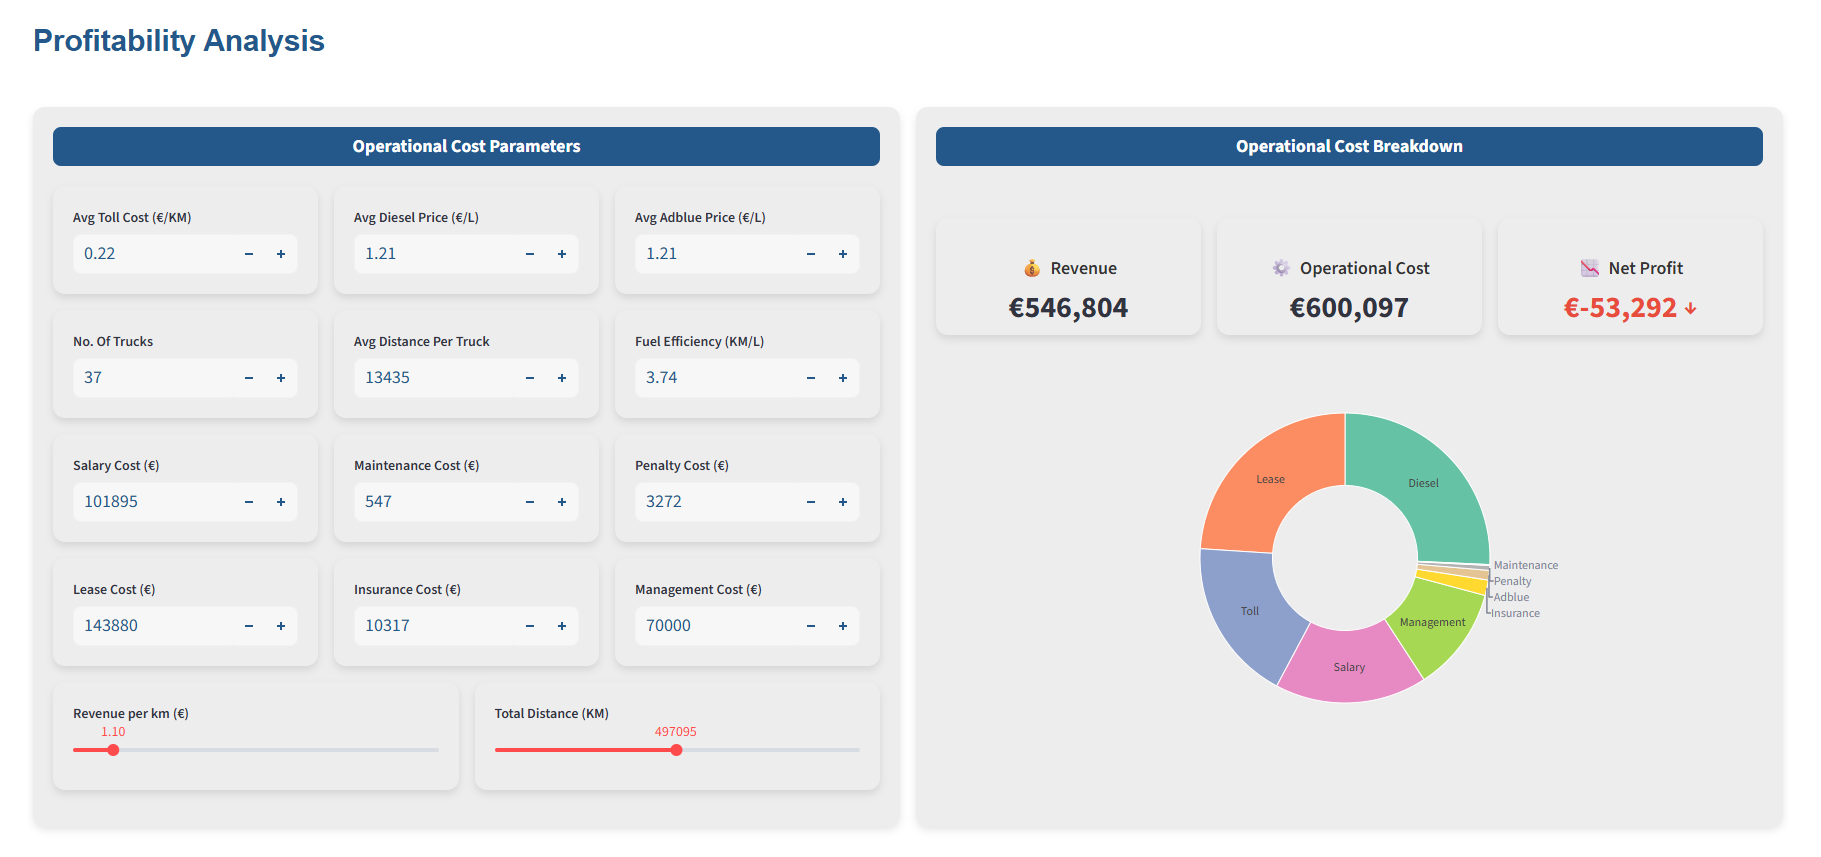
- Adjustable inputs for cost components, pricing, and volume
- Real-time calculation of revenue, costs, and profit
- Key Metrics widgets for quick interpretation
- Charts showing cost breakdown, profit distribution, or sensitivity
- Exportable reports summarizing key assumptions and outcomes
This approach helps businesses experiment with ideas before making real-world decisions — all in a secure browser-based environment.
Real Industry Use Cases
What-If analysis solutions support a wide range of industries and scenarios:
Financial Services
- Profitability modelling
- Interest rate sensitivity
- Loan pricing scenarios
Logistics & Supply Chain
- Trip-based cost modelling
- Driver/vehicle scenario simulation
- Fuel and toll forecasting
Retail & Consumer Business
- Price optimization
- Discount impact analysis
Operations & Planning
- Resource allocation
- Budget forecasting
Whether you’re planning next quarter’s financial forecast or optimizing operations, interactive What-If tools provide clarity and confidence.
Architecture Overview
The following diagram reflects the internal operational design of a Streamlit-based what-if simulator.
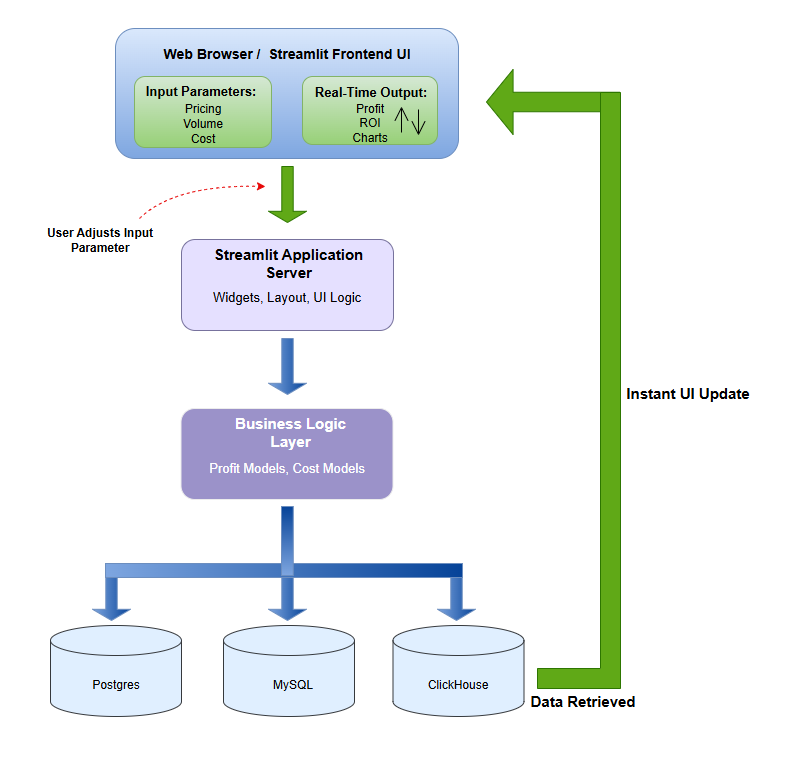
Our architecture is designed for:
- Modularity — separate layers for UI, business logic, and calculations
- Responsiveness — real-time recalculation and instant visual feedback
- Scalability — deployable on cloud, server, or container environments
- Security — access-controlled dashboards and isolated computation layers
We use modern Python frameworks and best practices to deliver a smooth experience without exposing internal complexities.
Deployment Options
Local Deployment
streamlit run app.py
Docker Deployment
FROM python:3.10-slim
WORKDIR /app
COPY . /app
RUN pip install streamlit pandas numpy reportlab plotly
EXPOSE 8501
CMD [“streamlit”, “run”, “app.py”, “–server.address=0.0.0.0”]
Cloud Deployment
- Streamlit Community Cloud
- Any container-based cloud platform (Azure, AWS, GCP)
Conclusion
Interactive What-If dashboards transform the way organisations evaluate scenarios, forecast outcomes, and make strategic decisions. By combining Streamlit’s powerful UI capabilities with our expertise in analytics and engineering, Axxonet delivers solutions that are:
- Simple to use
- Fully customizable
- Real-time
- Insight-driven
Businesses no longer need to rely on static spreadsheets — with dynamic What-If simulation, teams can explore opportunities, mitigate risks, and drive smarter decisions faster.
If you would like to enable this capability in your application, please get in touch with us at analytics@axxonet.net or update your details in the form
References
The following were the official documentation and resources referred to.
- Streamlit Official Documentation — Widgets, Layout, API Reference
https://docs.streamlit.io
2. Streamlit Deployment Documentation — Community Cloud, Docker, Configuration
https://docs.streamlit.io/streamlit-community-cloud
https://docs.streamlit.io/deploy/tutorials