
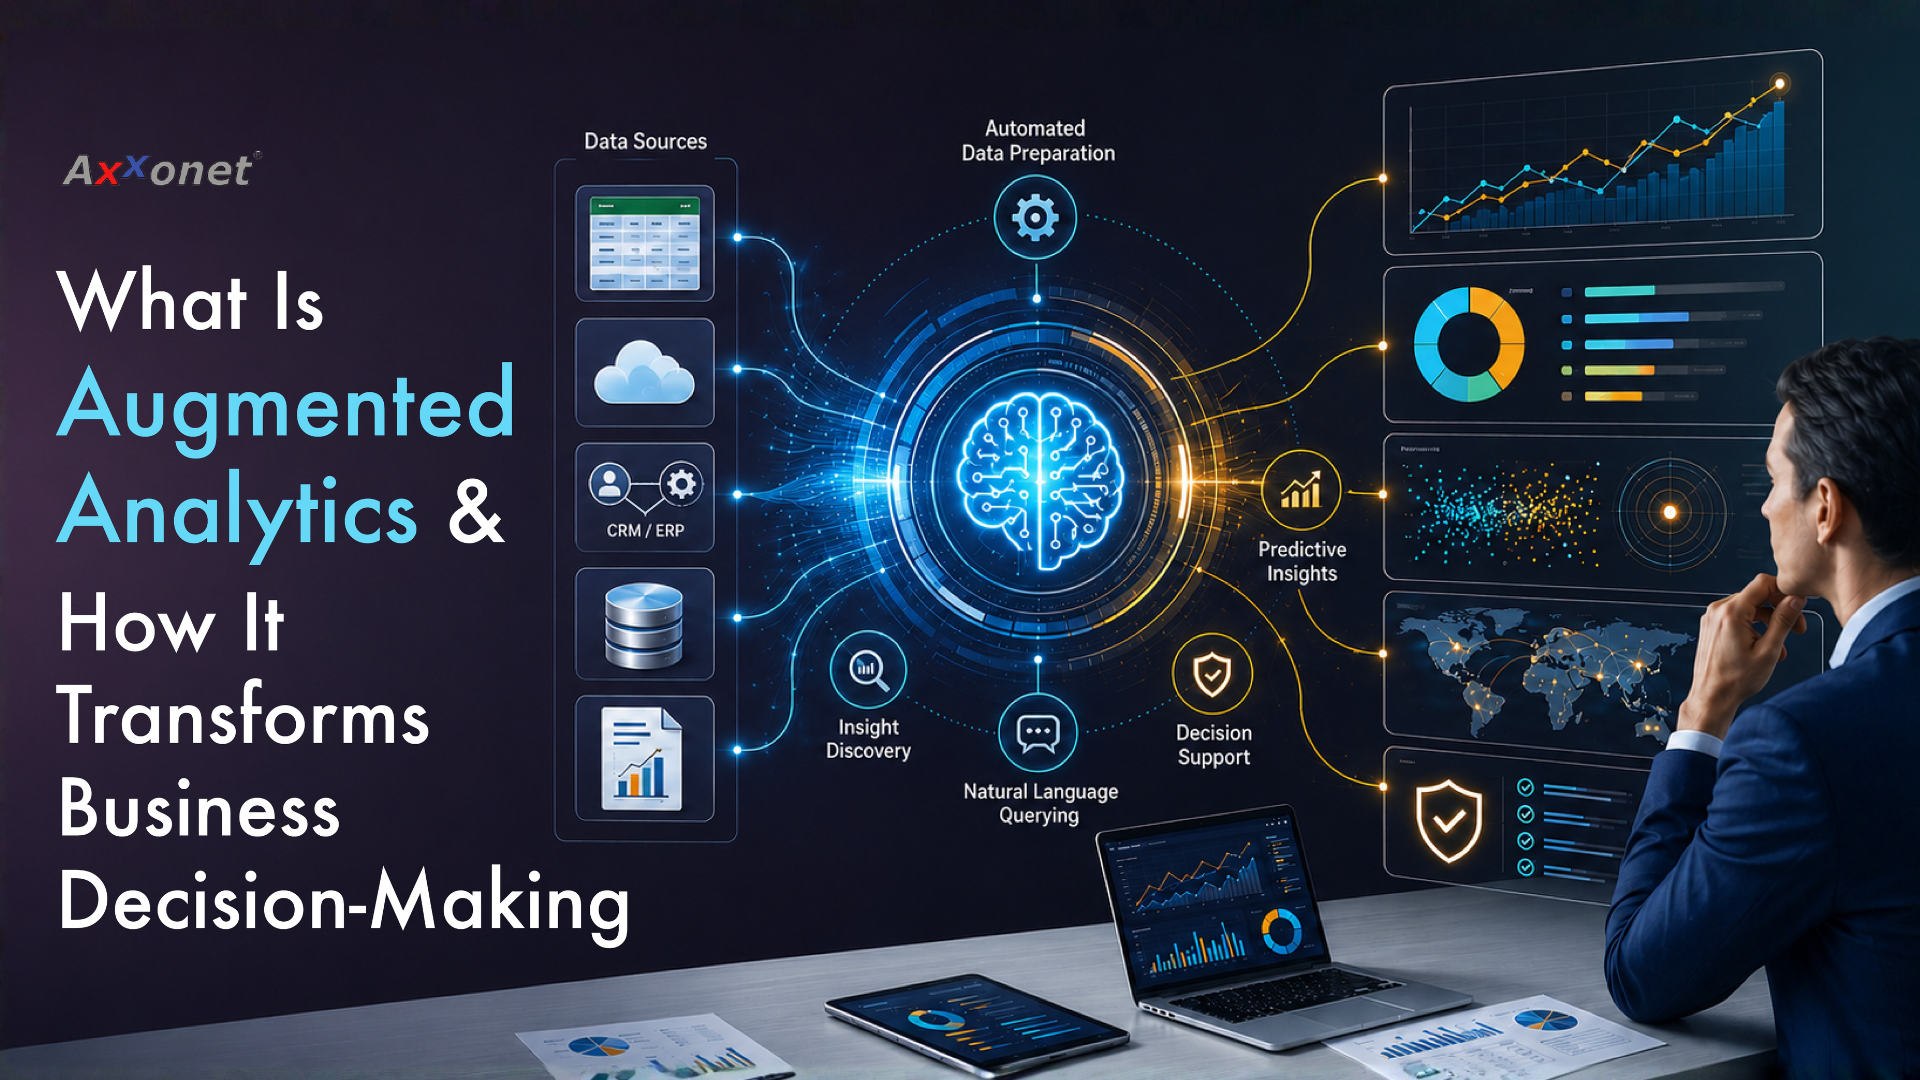
The Problem Starts With a Delayed Report
Your team runs a report. It takes two days to pull together. The data sits across multiple systems. Someone exports spreadsheets. Someone cleans the data manually. Someone else builds the presentation.
By the time the report reaches leadership, the meeting where the decision needed to happen is already over.
So the decision gets made another way, based on assumptions, instinct, or incomplete information.
For many organisations, this is still how decision-making works.
Modern businesses generate massive volumes of data from CRMs, ERPs, cloud applications, customer platforms, operational systems, and connected devices. But despite having more data than ever before, many teams still struggle to turn it into timely, usable insight.
The issue isn’t data availability. It’s the gap between information and action.
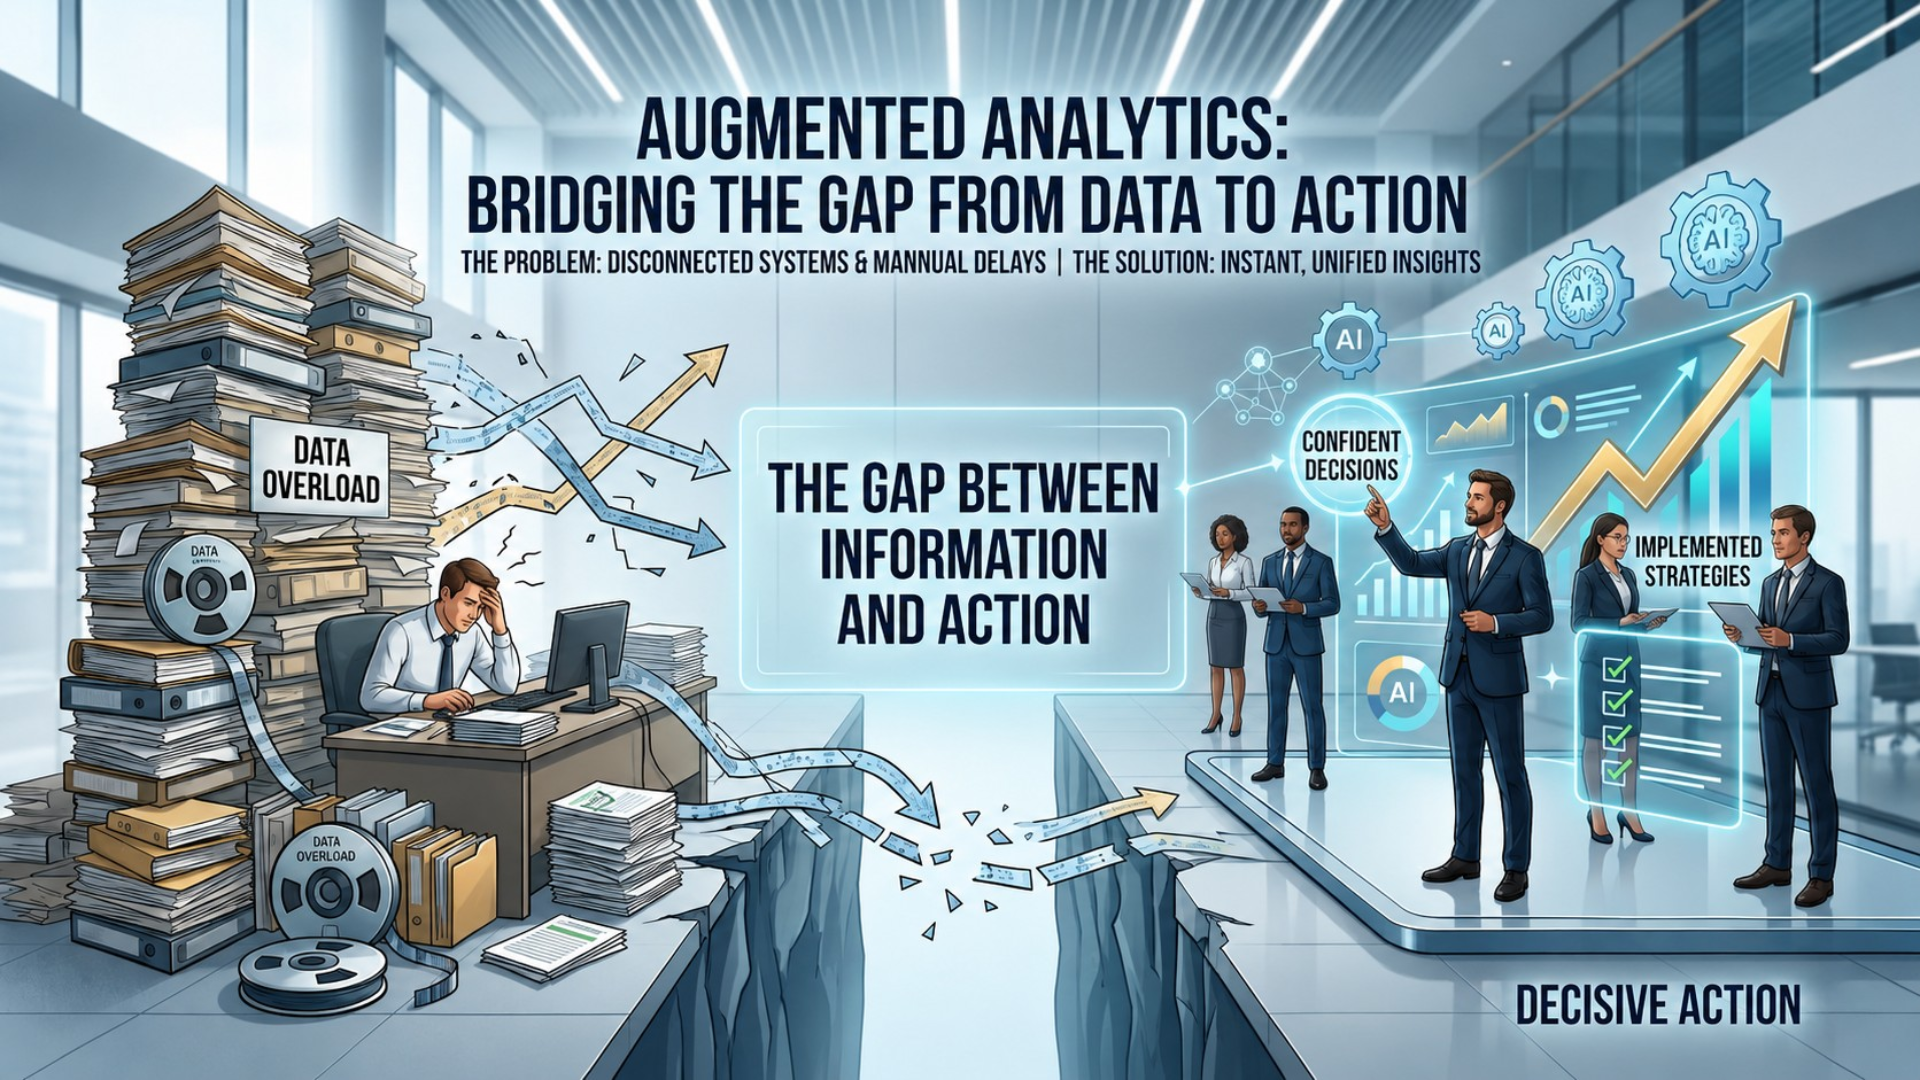
Reports take too long. Analysis depends on specialists. Business users can access dashboards but still can’t answer the questions that actually matter. And by the time insights are identified, the opportunity to respond may already be gone.
This is exactly the problem augmented analytics was designed to solve.
What Is Augmented Analytics?
Augmented analytics integrates artificial intelligence (AI), machine learning (ML), and natural language processing (NLP) to automate key parts of the analytics process.
Instead of relying entirely on analysts to prepare data, build queries, and identify trends manually, augmented analytics platforms streamline these tasks and deliver insights directly to decision-makers.
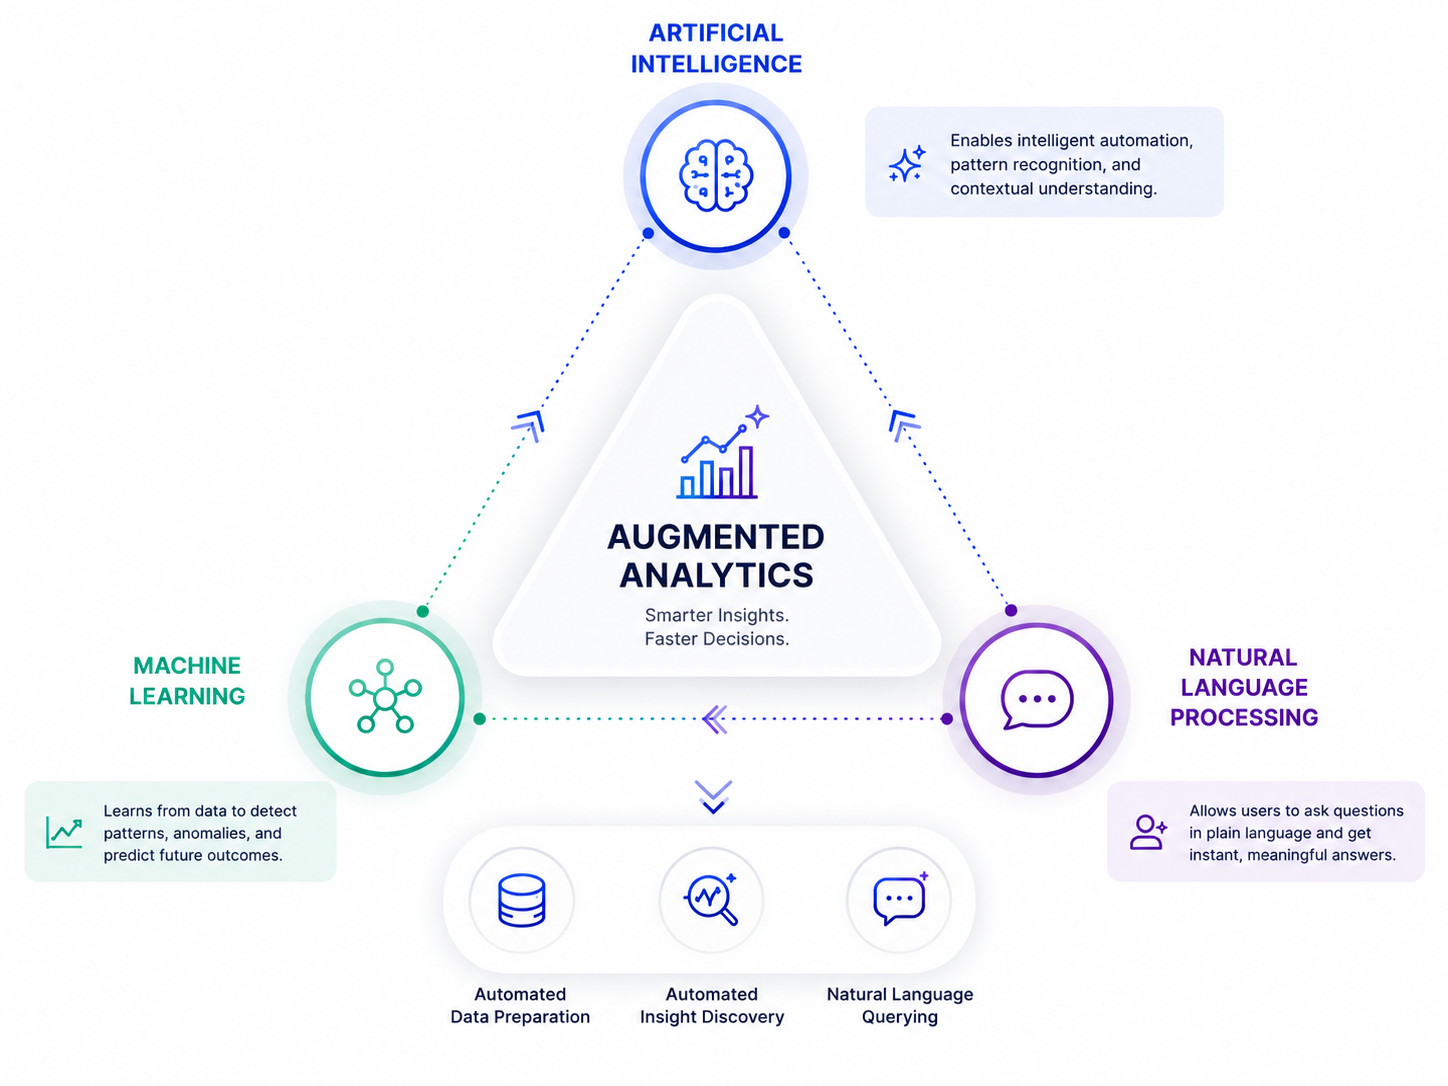
At its core, augmented analytics focuses on three major capabilities:
- Automated Data Preparation
Raw data is cleaned, structured, enriched, and standardised automatically, reducing the manual effort required before analysis can begin.
2. Automated Insight Discovery
The system continuously analyses datasets to identify patterns, anomalies, correlations, and operational changes that may require attention.
3. Natural Language Querying (NLQ)
Business users can ask questions in plain English instead of writing technical queries or relying on analysts for every request.
For example:
- “Why did customer churn increase last quarter?”
- “Which regions are underperforming?”
- “What operational costs changed this month?”
The platform interprets the request and returns structured insights instantly.
Rather than replacing human judgment, augmented analytics removes the bottlenecks that slow decision-making down.
Why Traditional BI Is Hitting a Wall
Traditional business intelligence platforms transformed reporting by making organisational data more visible.
But modern business environments have evolved faster than traditional analytics workflows.
Today’s organisations operate with:
- Growing data volumes
- Multiple disconnected systems
- Continuous operational activity
- Shorter response cycles
- Higher expectations for self-service analytics
Most BI environments still depend heavily on technical teams to prepare reports, maintain dashboards, and interpret trends. As data complexity increases, this creates delays across the organisation.
The challenge is no longer collecting data.
It’s extracting meaningful insight quickly enough for it to be useful.
Traditional dashboards are also largely retrospective. They explain what already happened but provide limited support for understanding why it happened, what could happen next, or what action should be prioritised.
As a result, many businesses find themselves surrounded by information while still struggling to make confident, timely decisions.
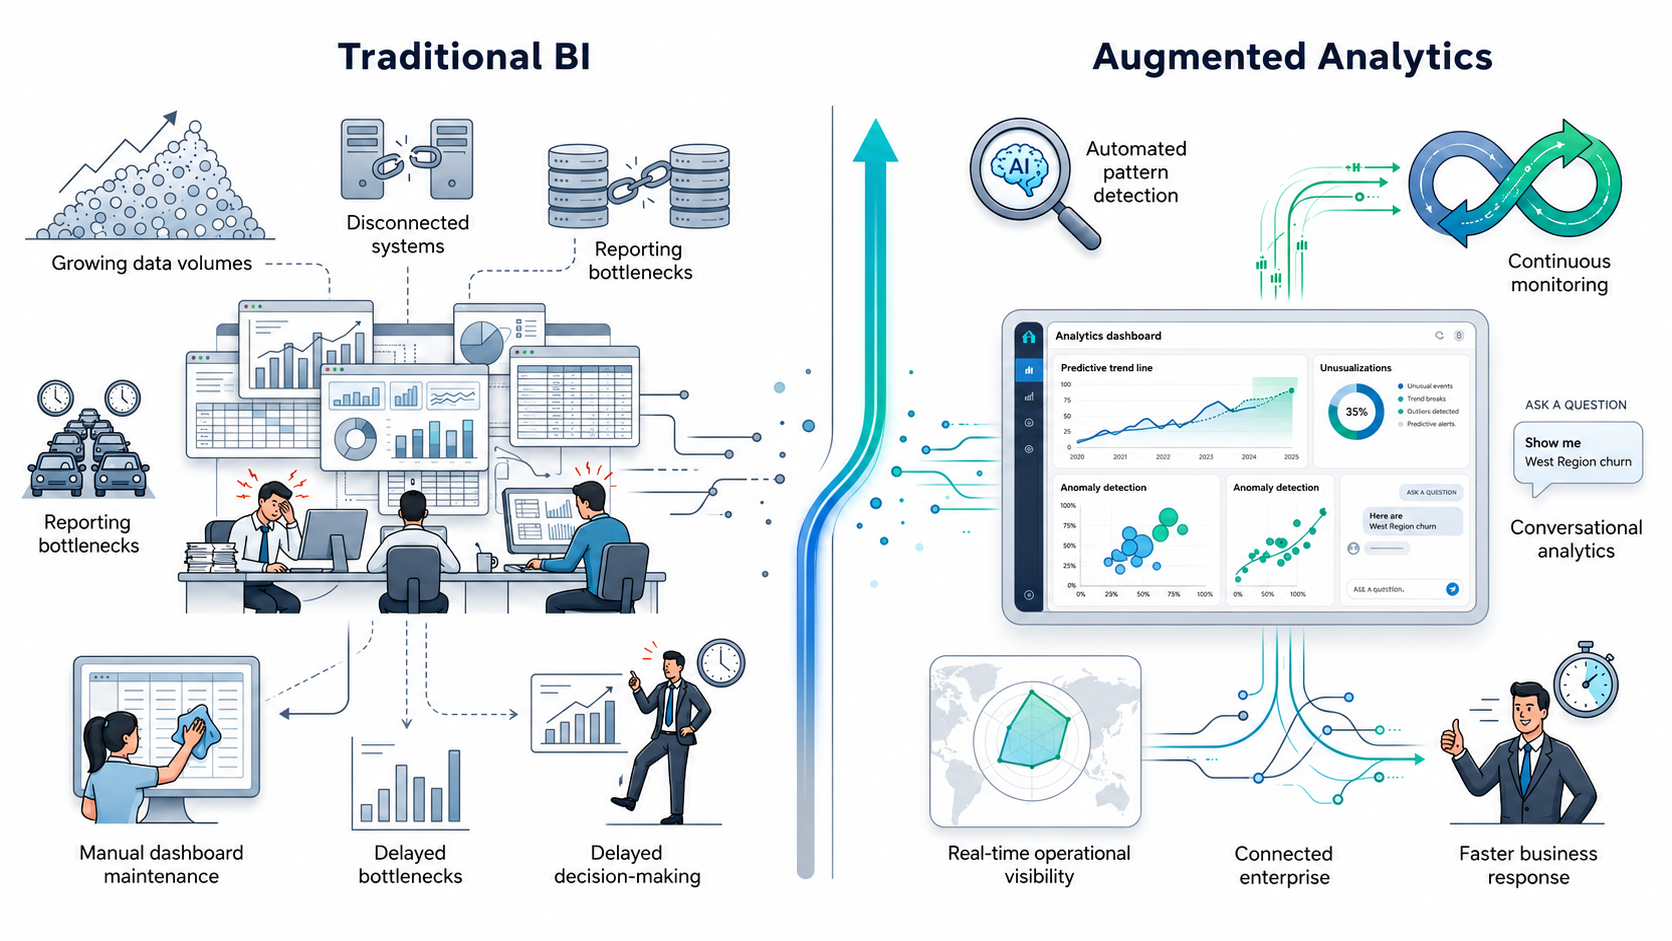
Augmented analytics addresses this by shifting analytics from passive reporting toward active decision support.
Gartner identified augmented analytics as “the future of data and analytics,” highlighting the growing need for machine learning-driven insight generation as organisations struggle to scale traditional analytics workflows.
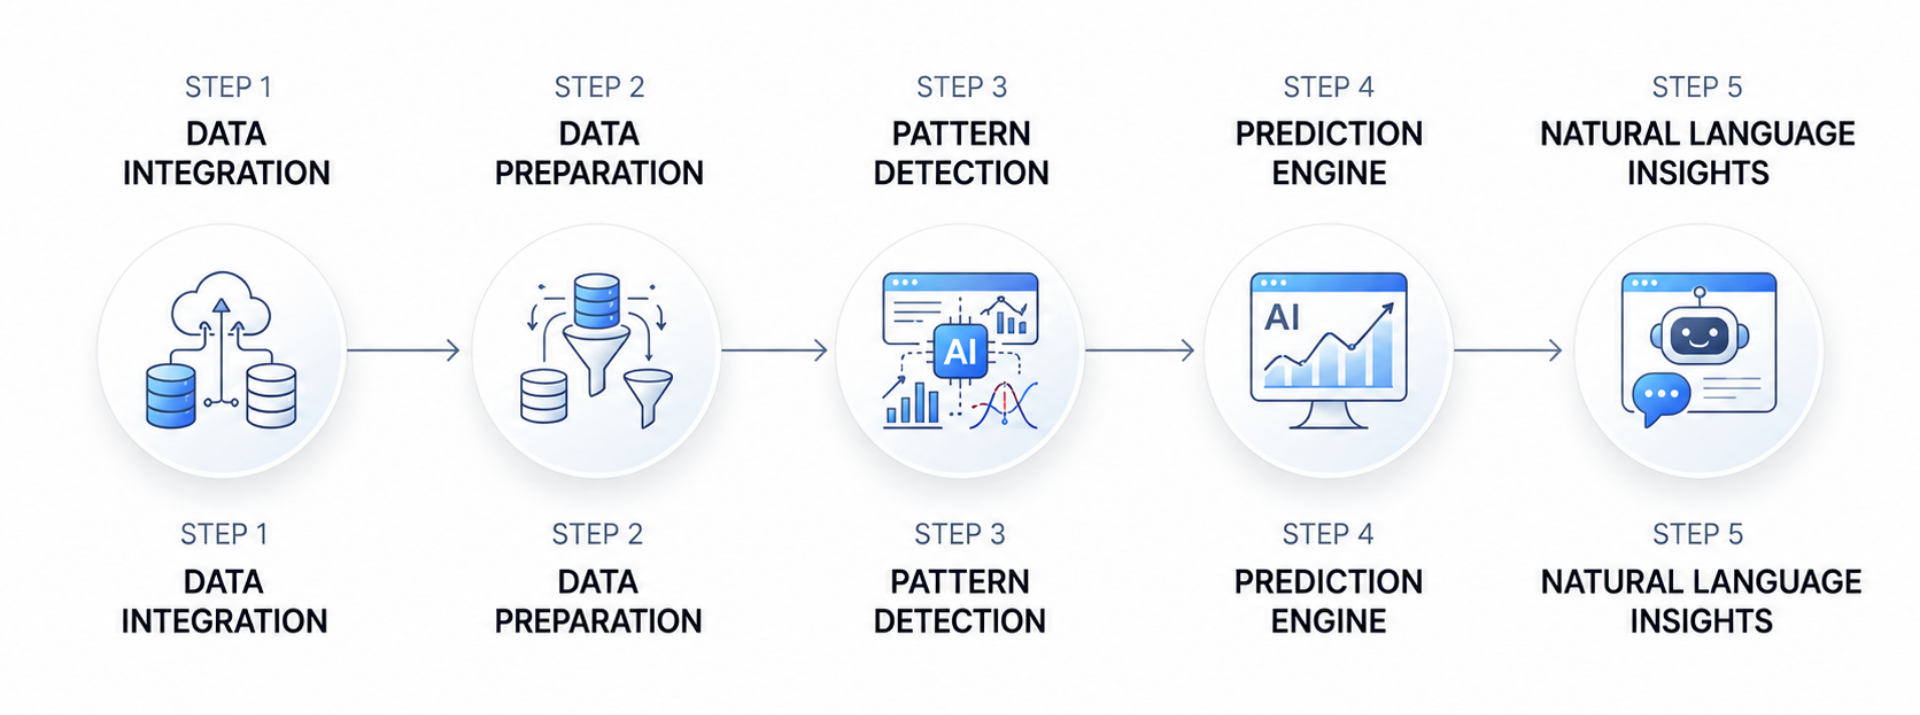
How Augmented Analytics Works
Augmented analytics combines automation, machine learning, and intelligent querying throughout the analytics workflow.
Step 1: Data Collection and Integration
The platform connects data from multiple business systems, including:
- CRM platforms
- ERP systems
- Operational databases
- Cloud applications
- Customer platforms
- IoT and infrastructure systems
This creates a unified analytical environment instead of isolated data silos.
Step 2: Automated Data Preparation
Machine learning models automatically clean, organise, and structure incoming data.
Tasks such as deduplication, formatting, anomaly checking, and standardisation happen with minimal manual intervention, significantly reducing preparation time.
Step 3: Pattern Detection and Analysis
The system continuously scans datasets to identify:
- Trends
- Performance shifts
- Correlations
- Unusual activity
- Operational risks
Instead of waiting for analysts to manually investigate reports, the platform proactively highlights signals that deserve attention.
Step 4: Insight Generation and Prediction
Once patterns are identified, the system generates contextual insights and predictive outputs.
Depending on the business use case, this may include:
- Revenue forecasting
- Churn prediction
- Demand forecasting
- Cost analysis
- Equipment failure prediction
- Risk identification
Some platforms also recommend potential actions based on historical performance and behavioural patterns.
Step 5: Natural Language Interaction and Visualisation
Users interact with the system conversationally.
Instead of building dashboards manually, business users can ask direct questions and receive structured visual responses immediately.
This significantly reduces dependency on technical analytics teams for everyday operational decisions.
How Decision-Making Changes
The biggest impact of augmented analytics is not simply automation.
It is the shift in how organisations respond to information.
Traditional Analytics | Augmented Analytics |
Reactive reporting | Proactive insight generation |
Manual data preparation | Automated workflows |
Analyst-dependent querying | Self-service access |
Historical analysis | Predictive intelligence |
Static dashboards | Dynamic contextual insights |
Scheduled reporting cycles | Continuous monitoring |
Manual anomaly review | Automated detection |
This changes the pace and quality of decision-making across the organisation.
Instead of waiting for periodic reports, teams can respond continuously to operational changes as they happen.
Research from McKinsey has consistently shown that data-driven organisations are significantly more likely to acquire customers, retain customers, and improve profitability compared to businesses relying primarily on traditional reporting approaches.
Applications Across Business Functions
Augmented analytics delivers value across multiple departments and operational environments.
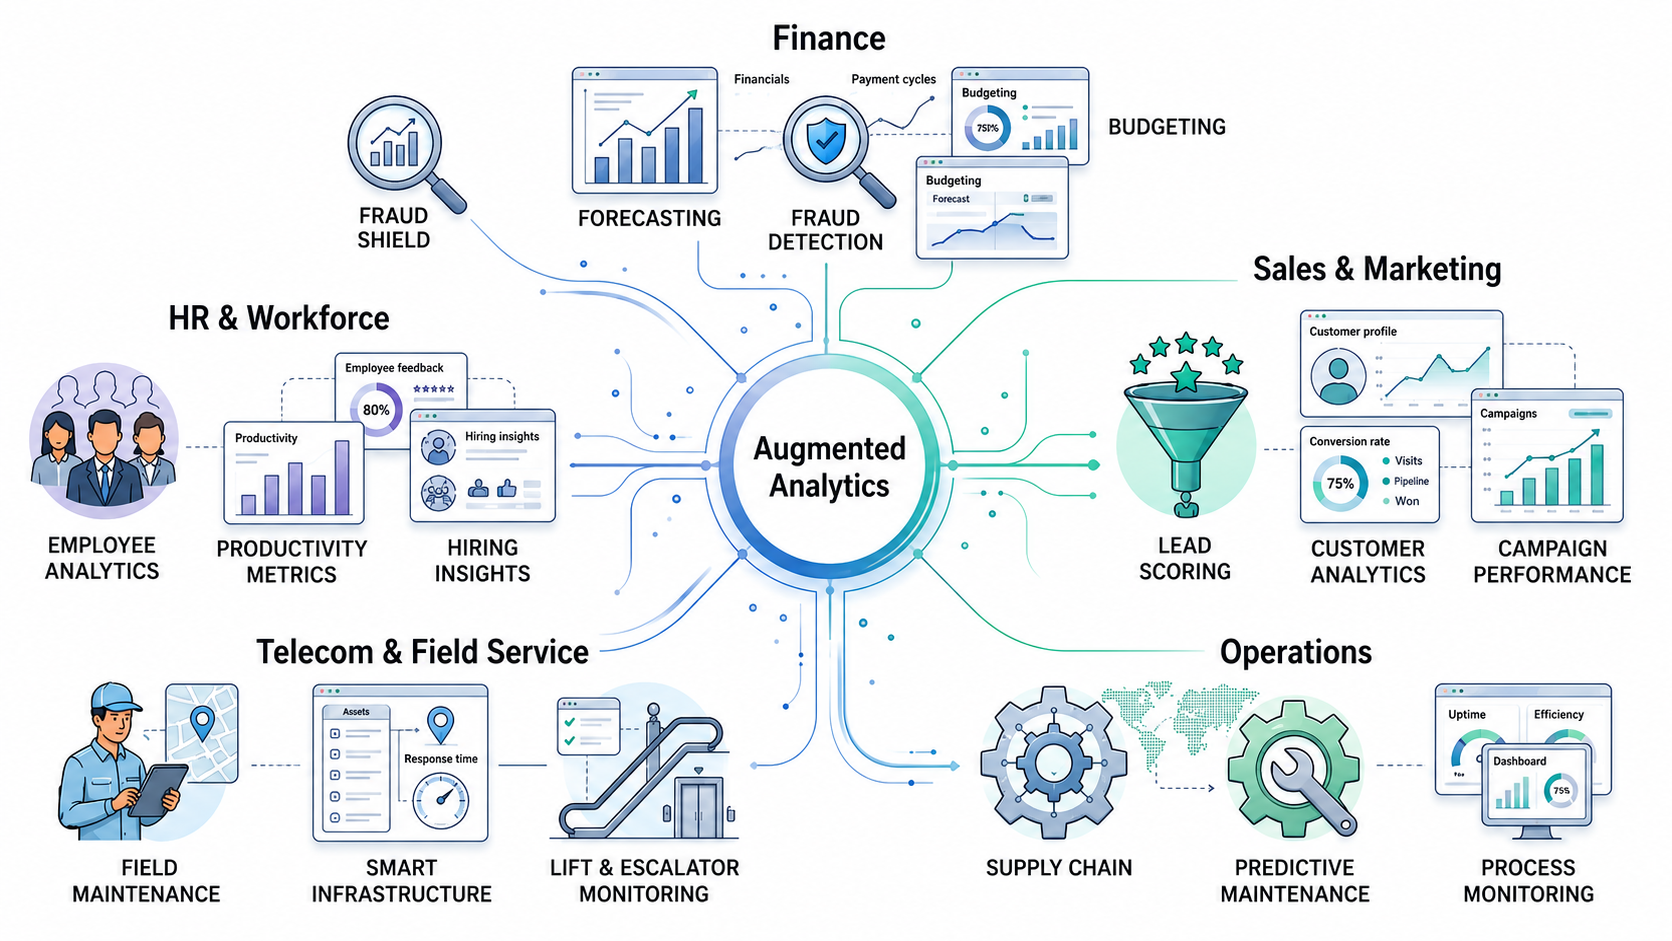
1. Finance
Finance teams use augmented analytics for:
- Automated variance analysis
- Fraud detection
- Budget forecasting
- Cash flow prediction
- Expense monitoring
2. Sales and Marketing
Sales and marketing teams can:
- Identify churn risk
- Improve lead scoring
- Detect campaign performance shifts
- Personalise customer engagement
- Forecast pipeline performance
This allows teams to prioritise opportunities more effectively and respond earlier to changing customer behaviour.
3. Operations
Operational teams use augmented analytics to:
- Monitor performance metrics
- Detect process inefficiencies
- Forecast supply chain disruptions
- Enable predictive maintenance
- Improve resource allocation
4. Telecom, Infrastructure, and Field Service
Telecom operators and field service organisations use augmented analytics to monitor infrastructure performance, identify service risks, optimise maintenance planning, and improve operational visibility across distributed environments.
5. HR and Workforce Analytics
HR teams can identify:
- Attrition risks
- Hiring bottlenecks
- Workforce productivity trends
- Employee engagement patterns
Platforms such as Avia Enterprises apply these capabilities across multiple service-driven industries including telecom, lift and escalator management, fire and safety systems, HVAC maintenance, facility operations, inspections, and broader field service environments by centralising operations, automating reporting, and improving maintenance intelligence.
When integrated into broader enterprise analytics environments, operational, ERP, asset, and service data can be unified into a single decision-support layer that improves visibility, coordination, and operational responsiveness across complex service ecosystems.
Where Augmented Analytics Fits in Data Maturity
One of the biggest misconceptions about augmented analytics is that it can solve foundational data problems on its own. It cannot.
Augmented analytics amplifies the value of an organisation’s data environment, which means the quality of outcomes depends heavily on the quality of the underlying data infrastructure.
Businesses typically move through several stages of analytics maturity:
- Manual reporting and spreadsheet-driven workflows
- Traditional dashboard-based BI
- Integrated self-service analytics
- Predictive analytics and automation
- AI-driven decision intelligence
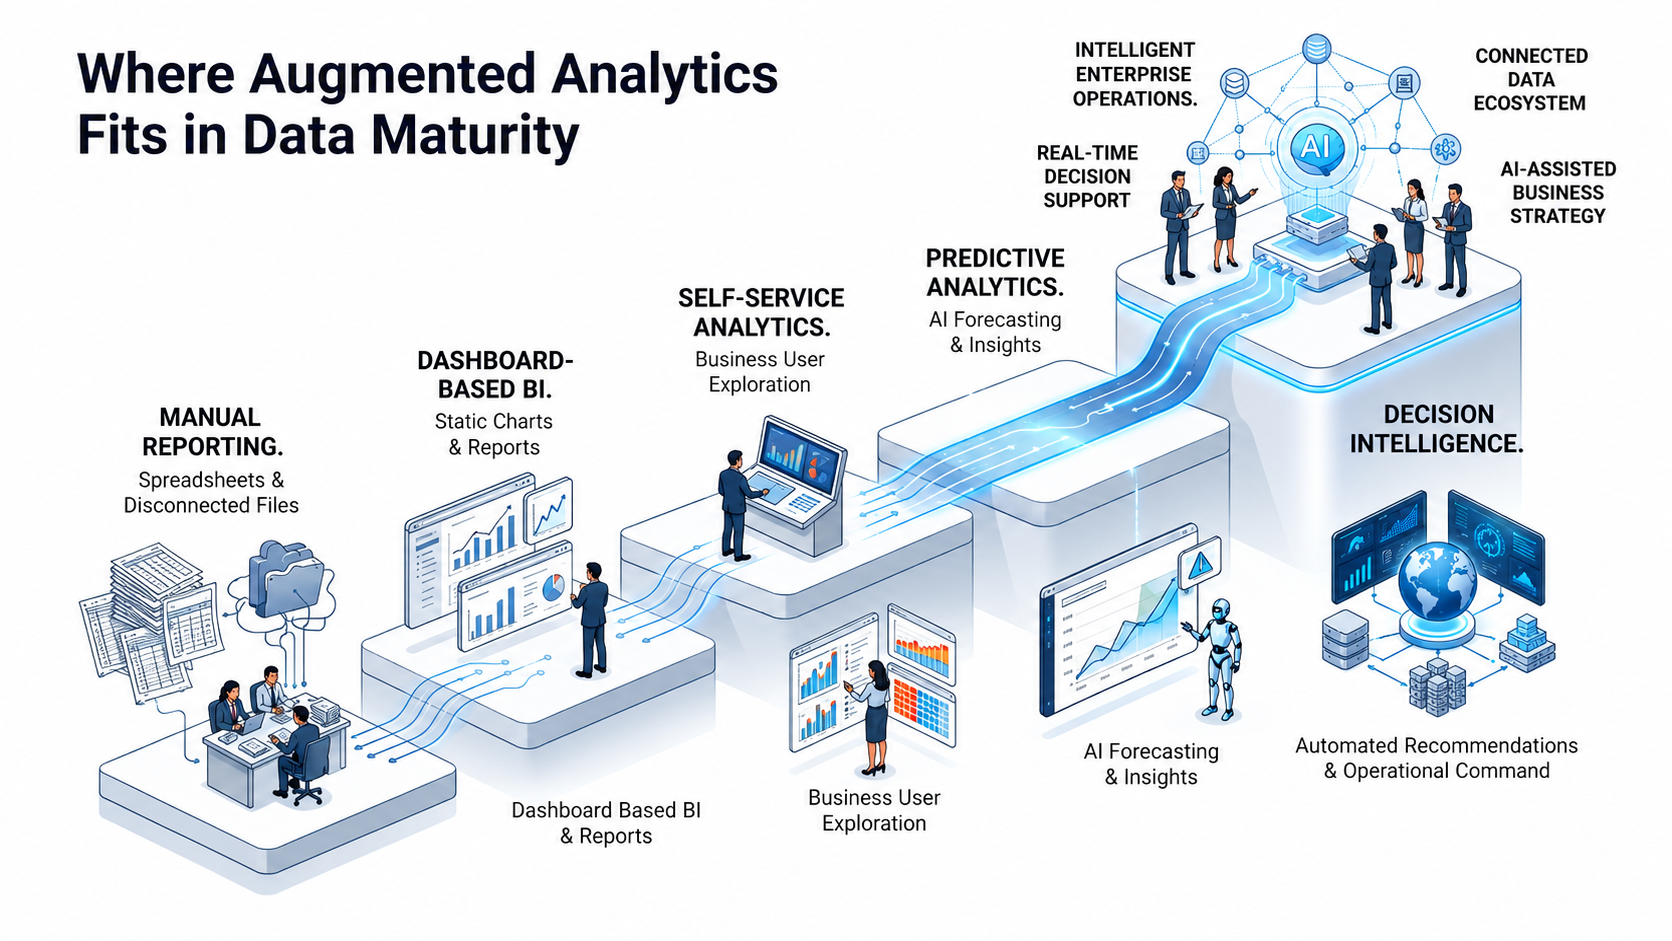
Organisations in earlier stages should prioritise building connected, structured, and governed data environments first.
Businesses with more mature analytics foundations are better positioned to adopt augmented capabilities successfully and move toward predictive, continuously optimised operations.
At Axxonet, we help organisations across every stage of this maturity journey, from enhancing and connecting foundational data infrastructure to implementing advanced analytics environments that support enterprise-scale decision-making.
Understanding where your organisation currently sits in its digital transformation journey is critical before implementing advanced analytics capabilities. For a deeper breakdown of digital maturity stages and the next steps businesses should prioritise, read our article: “Where Are You in Your Digital Transformation Journey? (And What to Do Next).”
What to Look for in an Augmented Analytics Platform
Not all augmented analytics platforms are designed for the same level of operational complexity.
Before selecting a platform, businesses should evaluate several critical capabilities.
- Ease of Use
The platform should allow non-technical users to explore insights without requiring advanced analytical expertise.
- Natural Language Capabilities
A strong conversational interface improves accessibility and increases adoption across business teams.
- Explainability
Insights should include contextual explanations, not just outputs. Decision-makers need to understand why patterns are occurring before taking action.
- Integration Flexibility
The platform should connect seamlessly across cloud systems, operational databases, enterprise applications, and existing BI environments.
- Governance and Security
Role-based access, auditability, data lineage, and governance controls are essential for enterprise deployment.
- Scalability
The system should support growing data volumes, expanding user numbers, and increasingly complex operational environments without introducing significant friction.
Platforms such as Pyramid Analytics, now part of ServiceNow, are increasingly being adopted because they combine business intelligence, natural language querying, AI-driven modelling, and automated insight generation within a unified enterprise analytics environment.
Common Implementation Pitfalls
While augmented analytics offers significant advantages, implementation challenges still matter.
- Building on Poor Data Foundations
If underlying data is incomplete, inconsistent, or fragmented, the insights generated will also be unreliable. Strong governance and structured data architecture remain essential.
Industry research increasingly shows that many AI and analytics initiatives underperform not because of the analytics tools themselves, but because organisations lack consistent, governed, and trustworthy data environments.
- Treating Automation as a Replacement for Judgment
Augmented analytics improves analytical capacity, but human oversight still matters. The technology supports decision-making; it does not replace strategic thinking.
- Low User Adoption
Analytics initiatives often fail when business users are not included early in implementation planning. Successful adoption requires training, change management, and workflows that align with how teams already operate.
- Choosing Tools Based on Features Alone
Many platforms demonstrate impressive capabilities in isolation but become difficult to integrate within existing enterprise environments. Platform selection should be based on operational fit, scalability, and long-term usability, not feature lists alone.
- Weak Governance
As analytics access expands across teams, governance becomes even more important. Without clear access controls, validation processes, and accountability structures, organisations risk creating inconsistent or poorly interpreted outputs at scale.
The Future of Business Decision-Making Is Augmented
For years, the focus of enterprise analytics was centred on collecting and storing data.
Today, most organisations already have more information than they can effectively use.
IDC research continues to highlight the rapid growth of enterprise data volumes and the operational challenges businesses face when trying to convert expanding datasets into actionable insight.
The real challenge is reducing the distance between data and action.
Augmented analytics changes that by reducing the time, technical complexity, and operational friction involved in generating insights.
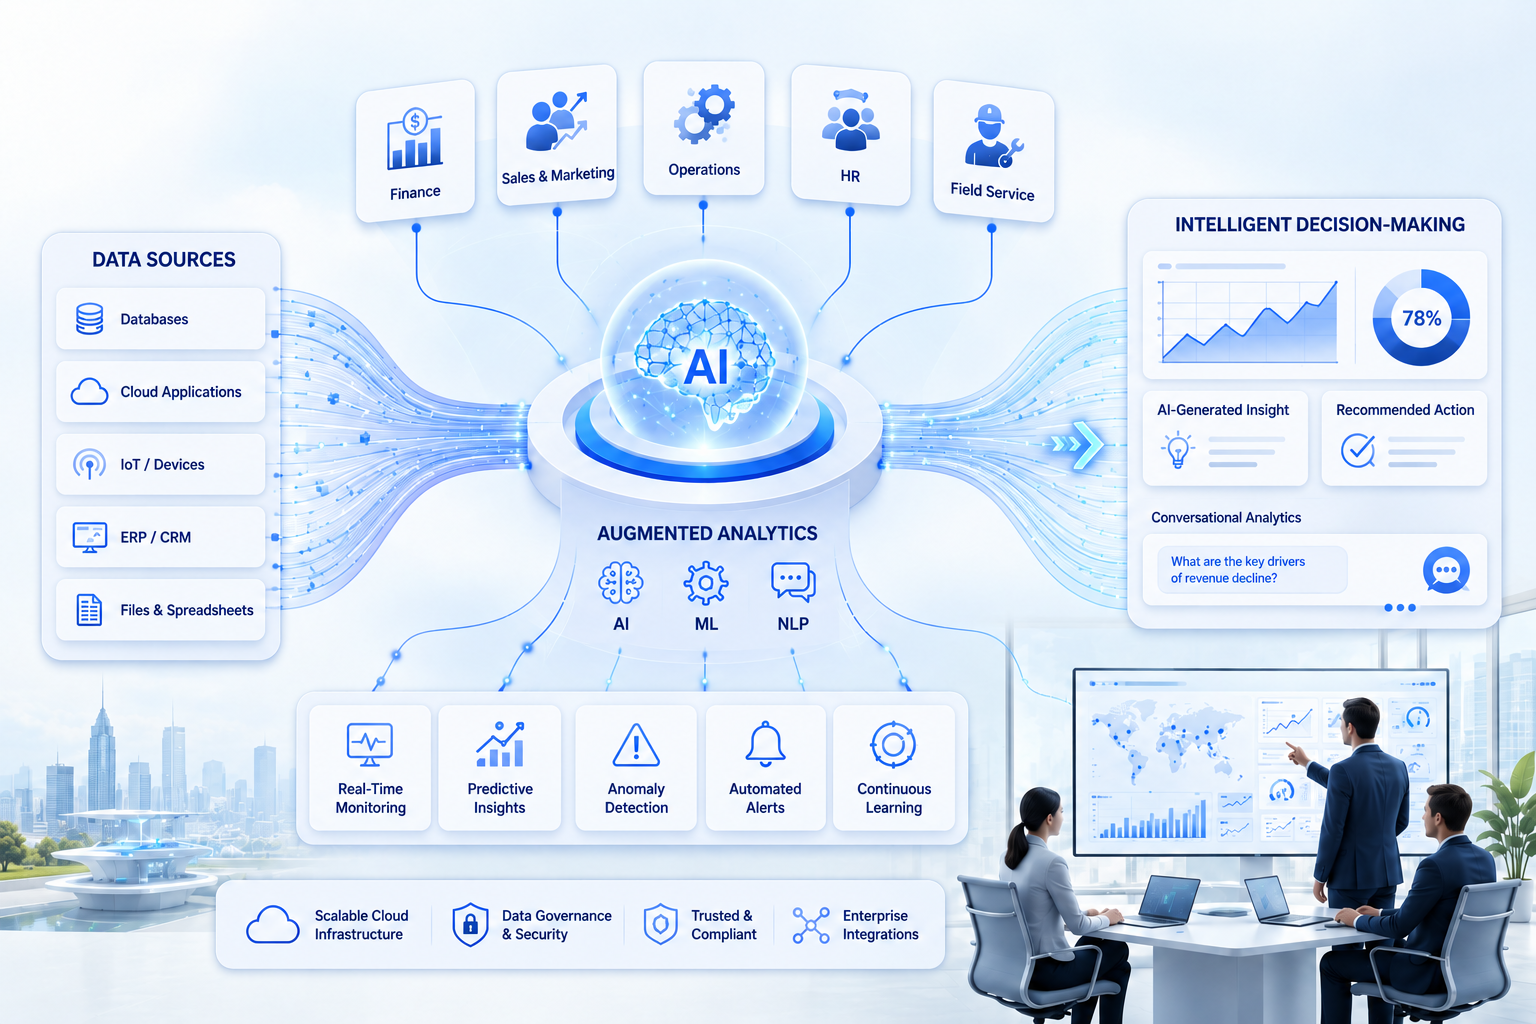
When businesses can identify risks earlier, detect opportunities faster, and distribute analytical capability beyond specialist teams, decision-making becomes more responsive across the organisation.
This is what makes augmented analytics important.
Not simply because it automates reporting, but because it changes how organisations operate in increasingly data-intensive environments.
Summary
Business Need | Traditional BI | Augmented Analytics |
Understand performance | Historical dashboards | Contextual, prioritised insights |
Detect anomalies | Manual investigation | Automated detection |
Answer operational questions | Analyst-driven reporting | Natural language querying |
Forecast future outcomes | Spreadsheet modelling | Predictive analytics |
Speed from data to action | Delayed reporting cycles | Continuous insight delivery |
Accessibility | Limited to technical teams | Broader business access |
Ultimately, augmented analytics helps organisations move beyond static reporting toward more adaptive, intelligence-driven decision-making.
The question is no longer whether businesses have enough data.
The question is whether they can act on it fast enough to create value.
At Axxonet, we work with organisations to strengthen and connect their existing analytics environments, helping teams improve visibility across operations, streamline reporting workflows, and make enterprise data more usable across day-to-day decision-making. Whether businesses are expanding current BI capabilities or exploring augmented analytics adoption, the focus remains on making existing systems work more intelligently and cohesively at scale.
If you're evaluating where augmented analytics fits into your organisation’s strategy, our team can help you assess your current data maturity and identify the next steps forward.
And explore how augmented analytics can support smarter, faster, and more scalable decision-making across your business.
Frequently Asked Questions
They overlap, but they are not identical.
AI analytics is a broad term covering any use of artificial intelligence in data analysis. Augmented analytics is more specific; it refers to AI and machine learning being embedded directly into the analytics workflow to automate data preparation, insight discovery, predictive analysis, and natural language querying.
In simple terms, all augmented analytics uses AI, but not all AI analytics is augmented analytics.
No. One of the biggest advantages of augmented analytics is that it makes analytical capabilities accessible to business users without requiring data science expertise.
However, organisations still need connected, well-governed data infrastructure and a proper implementation strategy to ensure reliable outcomes.
Power BI and Tableau are primarily reporting and visualisation platforms. They help users explore and present data that has already been prepared and structured.
Augmented analytics goes further by automating the process of identifying patterns, detecting anomalies, generating insights, and enabling users to interact with data through natural language queries.
Some BI platforms are introducing augmented features, but dedicated augmented analytics platforms typically provide deeper automation and predictive capabilities.
At a minimum, organisations should have:
- Connected and consistent data sources
- A centralised data layer, such as a data warehouse or lake
- Structured and governed data environments
If data remains fragmented across disconnected systems, the insights generated will also be fragmented. Strong data foundations are essential for successful augmented analytics adoption.
Implementation timelines vary depending on the complexity of the organisation’s data environment, existing infrastructure, and the platform being deployed.
For businesses with reasonably mature and connected data systems, an initial augmented analytics implementation typically takes around 4–6 weeks. Organisations that require additional data integration, governance alignment, or infrastructure preparation may require a longer rollout period.
In most cases, phased implementation approaches deliver more reliable and scalable outcomes than attempting full-scale deployment all at once.
Augmented analytics helps organisations solve problems related to delayed reporting, disconnected data, limited operational visibility, manual analysis workflows, and slow decision cycles.
It is particularly valuable in environments where teams need to identify risks, monitor performance, forecast outcomes, or respond quickly to operational changes.
Yes. Modern augmented analytics platforms can process and analyse continuously updated operational data from systems such as ERP platforms, IoT infrastructure, customer applications, and field service environments.
This allows organisations to monitor performance continuously instead of relying solely on scheduled reports.
No. While large enterprises often adopt augmented analytics at scale, small and mid-sized organisations can also benefit significantly.
Businesses experiencing growing operational complexity, increasing data volumes, or reporting bottlenecks often see strong value from automating analytics workflows and improving accessibility to insights.
One of the most common mistakes is implementing advanced analytics platforms before establishing a reliable data foundation.
If systems remain disconnected or data quality is inconsistent, even advanced analytics tools will produce unreliable outputs. Successful adoption depends as much on governance and integration as it does on the technology itself.
Businesses should evaluate platforms based on:
- Ease of use for non-technical users
- Integration capabilities
- Scalability
- Governance and security controls
- Natural language querying
- Predictive analytics capabilities
- Explainability of insights
The right platform should align with both the organisation’s technical environment and operational decision-making needs.