

Introduction
Data is everywhere inside modern businesses. ERP systems track production and inventory. CRMs capture customer activity. Logistics platforms monitor shipments. Operational systems generate information every minute.
But having data inside an application does not necessarily mean having insights where they are needed.
A production manager may have to leave an ERP system, open a separate BI dashboard, find the right report, identify a production bottleneck, and then return to the operational system to take action. The data exists. The dashboard exists. But the insight is disconnected from the workflow, a gap that shows up constantly in practice, from spreadsheets and paper logs standing in for the system of record to execution still happening over WhatsApp and registers long after an ERP is already in place.
Embedded analytics addresses this gap by bringing analytics directly into the applications where people work and make decisions, closing the distance between seeing a number and doing something about it.
The stakes are bigger than a single dashboard. The McKinsey Global Institute estimates that data and analytics could unlock between $9.5 trillion and $15.4 trillion in value annually across industries if embedded at scale into how organizations actually operate, not left sitting in a reporting layer that people have to go looking for.
What Is Embedded Analytics?
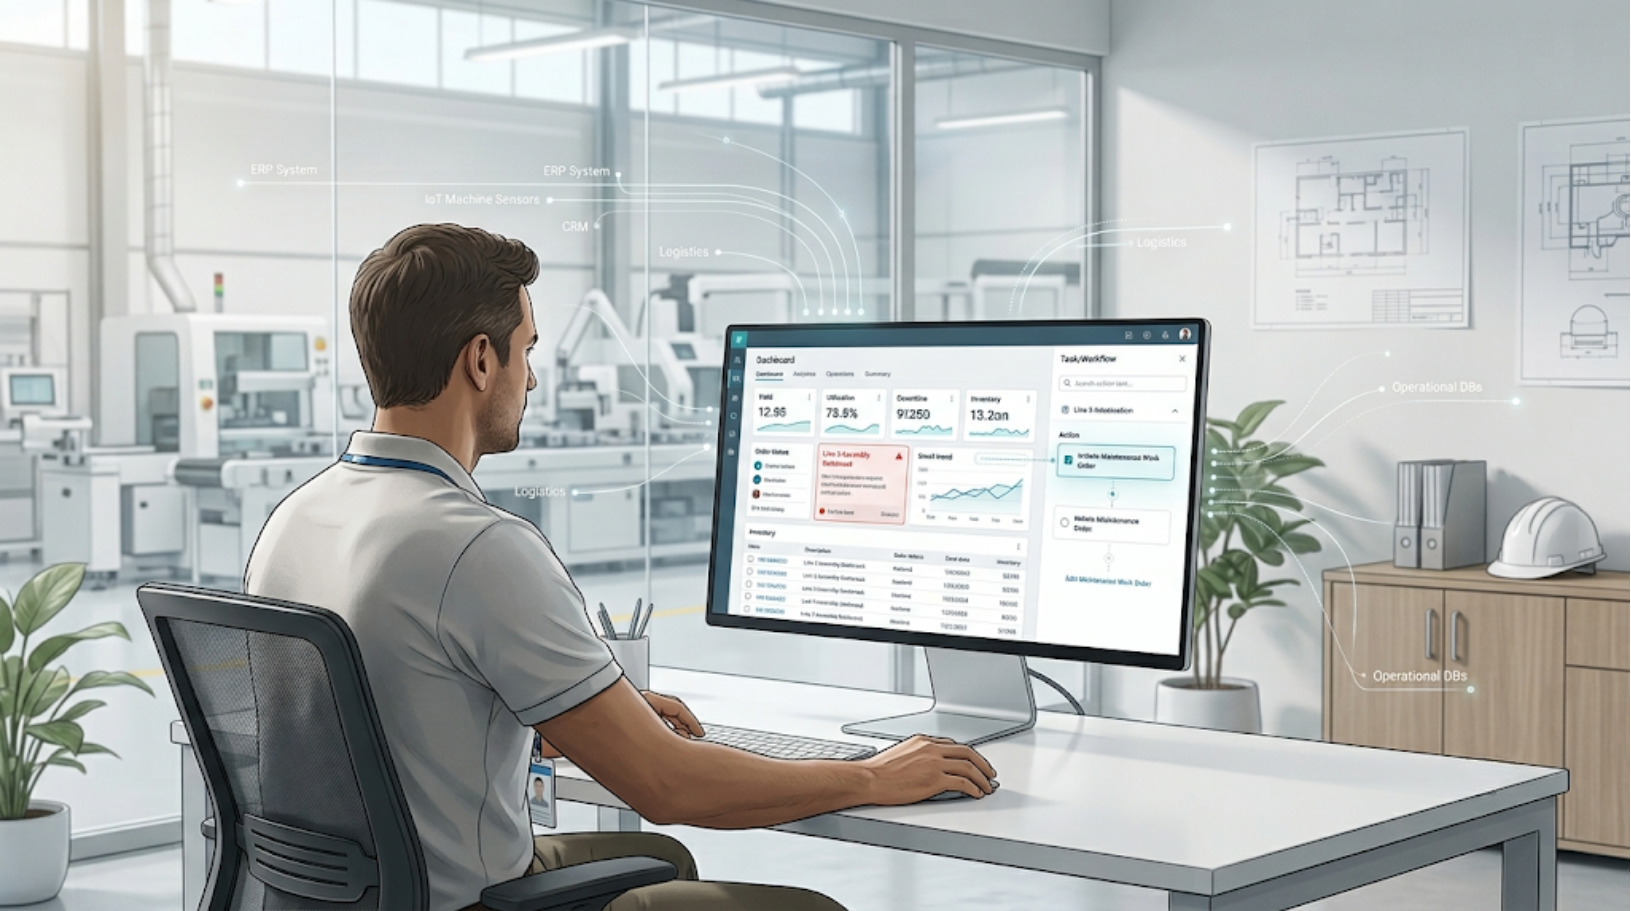
Embedded analytics is the integration of analytical capabilities, such as dashboards, reports, KPIs, charts, and data visualisations, directly into an application or software interface.
The goal is simple: put relevant insights in the same environment where users are already working.
Consider a manufacturing application. With a traditional setup, a production manager might follow a path like this:
ERP → Export data → Open BI tool → Find dashboard → Analyse production → Return to ERP → Take action
With embedded analytics, several of those steps collapse:
Manufacturing application → View production metrics → Identify bottleneck → Take action
The difference isn’t just convenience. It changes when analytics get used. Traditional reporting tends to support analysis after the fact, once someone has already gone looking for it. Embedded analytics makes data part of the operational workflow itself, available at the moment a decision needs to be made.
How Does Embedded Analytics Work?
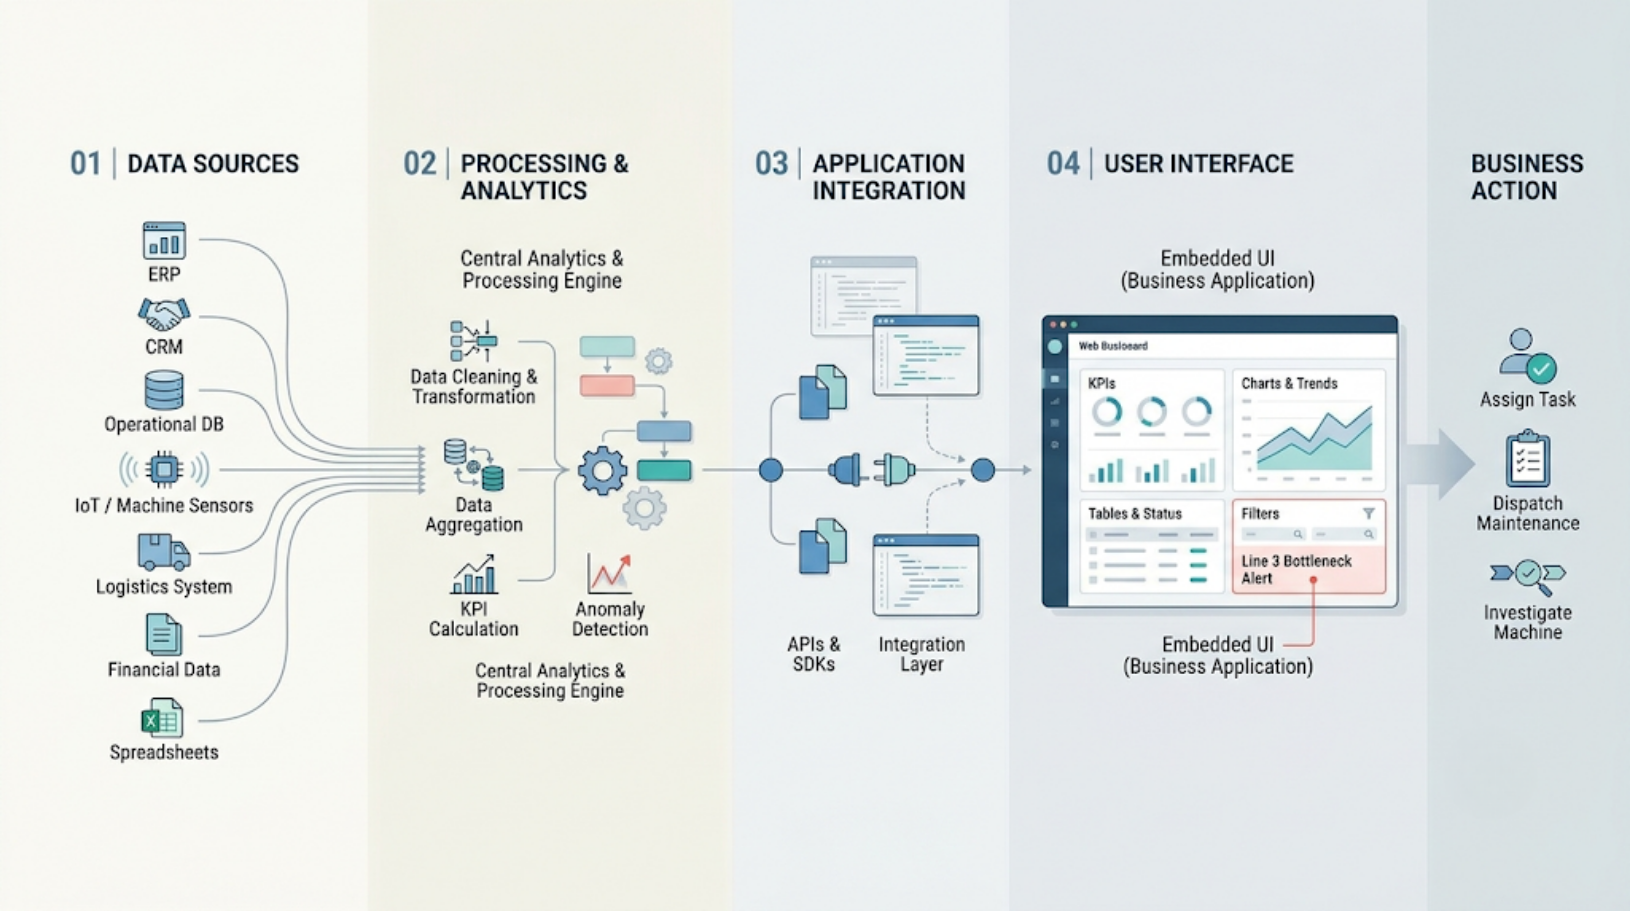
At a high level, an embedded analytics architecture connects business data with an analytics layer, then surfaces the resulting insights inside an application. Four things happen along the way: data gets gathered, processed, integrated into the interface, and finally acted on.
1. Data Sources
The first step is bringing together the data that users need to make decisions. Depending on the business, this could include ERP systems, CRM platforms, operational databases, APIs, IoT and machine data, logistics systems, financial systems, and spreadsheets.
The goal isn’t to funnel every available data point into one dashboard; it’s to identify the data relevant to a specific decision or workflow.
2. Data Processing and Analytics
Raw data usually needs to be cleaned, transformed, and structured before it produces a meaningful insight. This layer handles transformation, aggregation, KPI calculation, trend analysis, filtering, forecasting, and anomaly detection, turning raw numbers into information with business context.
3. Application Integration
The resulting analytics get built into the application’s interface. Depending on the architecture and requirements, this can happen through APIs, SDKs, embedded dashboards, visualisation components, application-native analytics, or iframe-based embedding.
The right approach depends on security requirements, scalability, customisation needs, and the type of application being built.
4. User Interface
The final insight can take the form of KPI cards, charts, tables, dashboards, reports, alerts, drill-down views, or interactive filters.
What matters most here is context. A warehouse manager doesn’t need the same analytics as a CFO. A production operator doesn’t need the same dashboard as a plant manager. Embedded analytics lets the application surface information based on who’s using it and what workflow they’re in, which brings us to the part that actually creates value.
From Insight to Action
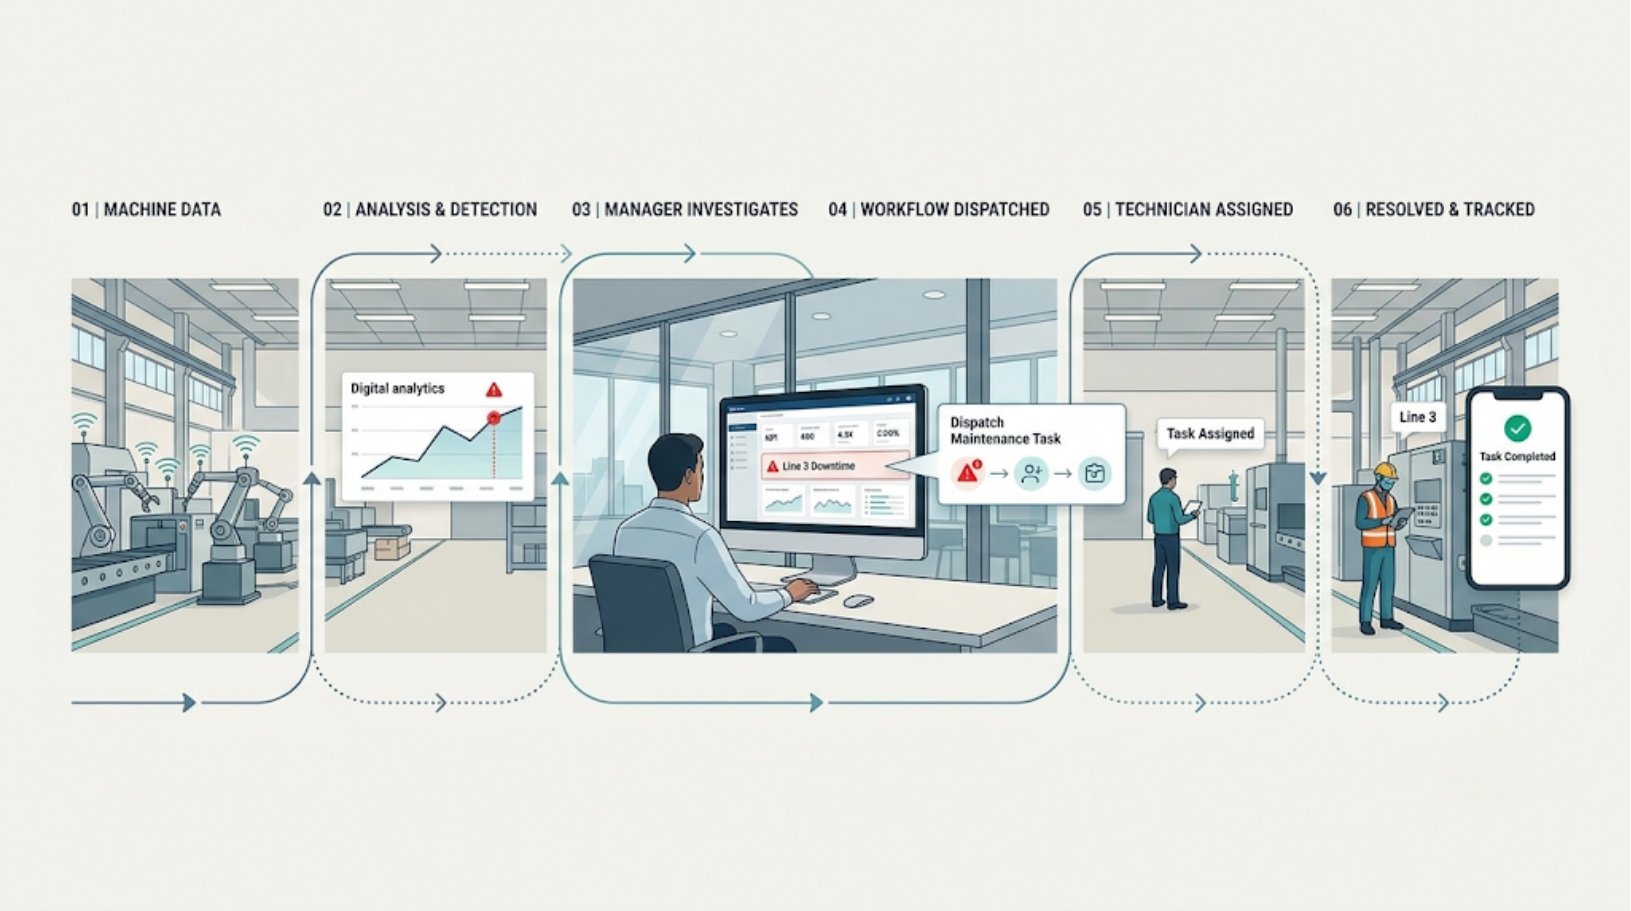
Visualising data is only half the job. The value comes from connecting insight to decision to action: if a production dashboard shows a machine’s downtime climbing, the application should let the manager investigate, trigger a maintenance workflow, assign a task, and track it to resolution, not just display the number and stop there.
Embedded Analytics vs. Traditional BI
Embedded analytics doesn’t replace traditional business intelligence; the two serve different purposes.
Traditional BI | Embedded Analytics |
Usually accessed through a separate analytics environment | Integrated into the application |
Often focused on organisation-wide reporting | Often focused on contextual, operational insights |
Users may switch between systems | Users can stay within their workflow |
Insights may be reviewed after an event | Insights can be available during the workflow |
Commonly supports analysts and decision-makers | Can support operators, managers, customers, and other users |
DA traditional BI dashboard might answer “what happened to production this month?” Embedded analytics is built to answer a narrower, more immediate question: “what’s happening with this order right now, and does it need attention?”
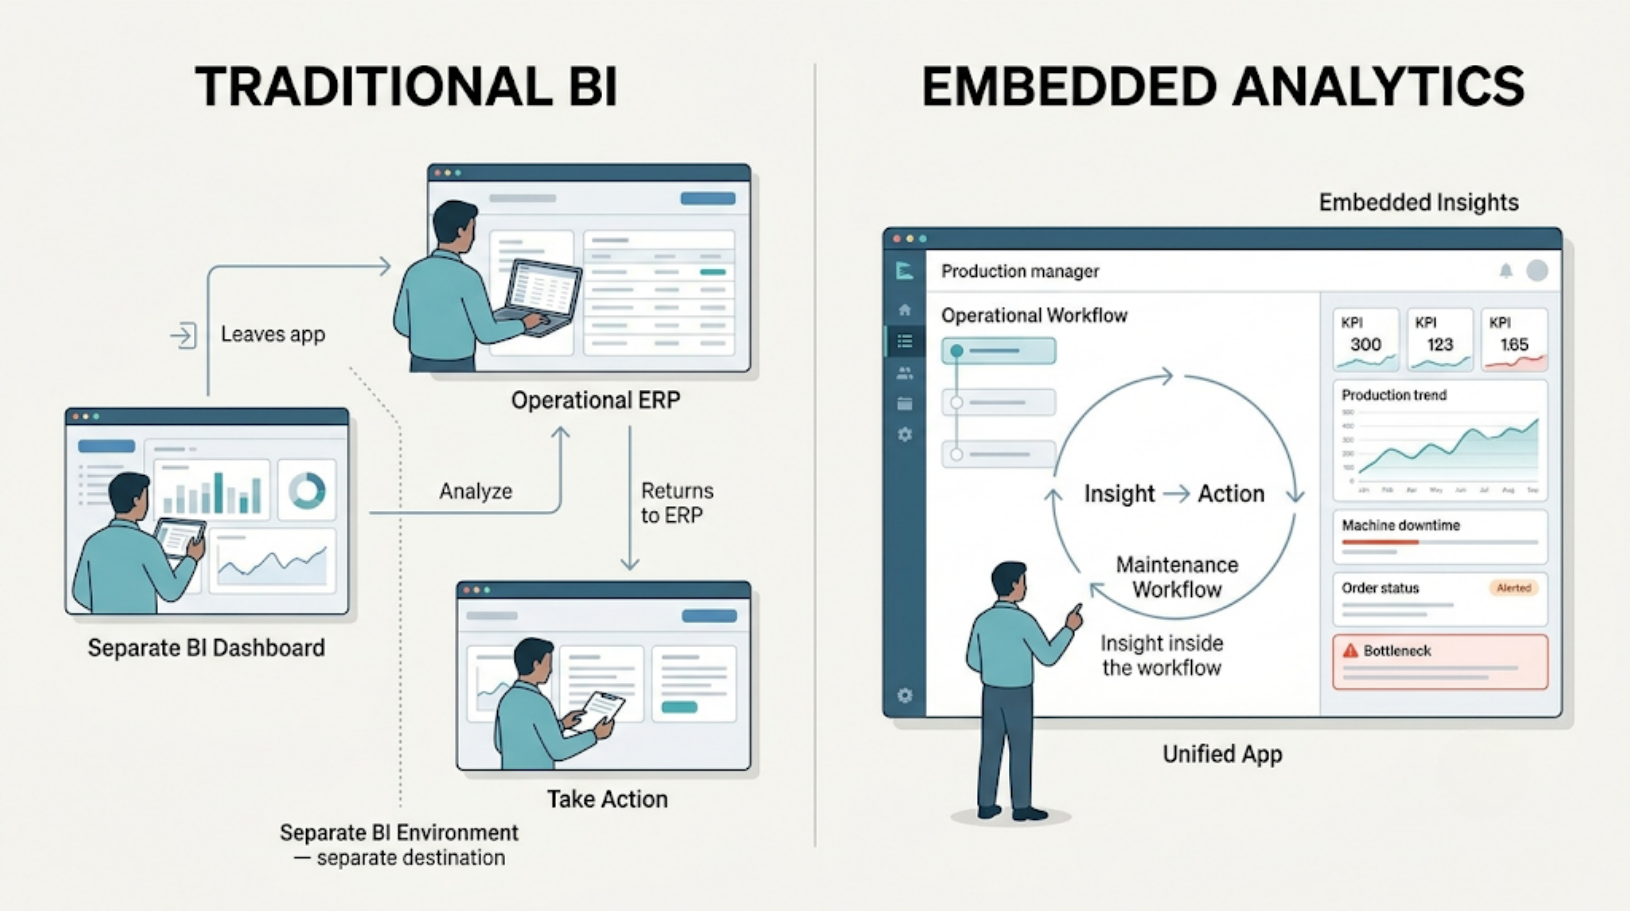
Both are valuable; the difference is where the analytics sit relative to the work.
If you’re also evaluating how to build and manage a broader BI strategy, see our guide on Business Intelligence Consulting vs In-House BI: Which Is Right for You?
Why Are Businesses Using Embedded Analytics?
Dresner Advisory Services’ 2025 Embedded Business Intelligence Market Study, the 13th consecutive year the firm has tracked this space, found that the importance organisations place on embedded BI is highest in healthcare, followed closely by manufacturing, and that current adoption has continued a multi-year rebound. For manufacturers and other operational businesses, in other words, this isn’t an emerging idea; it’s already one of the more established use cases in the category.
- Less Context Switching
Every time someone moves between applications, they lose time re-finding the right information and reconstructing context. Embedding relevant analytics directly into the application they’re already using removes that step.
- Data Becomes Part of Everyday Work
Analytics are often treated as something reviewed in meetings or at day’s end. Embedded into the workflow, they become part of the work itself — a sales rep sees account performance while reviewing the account; a warehouse manager sees inventory levels while processing an order.
- Faster Decisions
When the relevant metric is already on screen, users spend less time hunting for information and more time acting on it. This matters most when the issue is time-sensitive, like a delayed shipment or a machine failure that needs a response now, not after someone compiles a report.
- A Stronger Product for SaaS and Enterprise Vendors
Rather than asking customers to export data into a separate BI tool, the product can offer that reporting natively, making the application itself more valuable without customers having to build their own analytics workflow.
- Insight Matched to Role
An executive wants high-level revenue and operational KPIs. A plant manager needs production efficiency and downtime. An operator needs status on one specific machine or work order. Embedded analytics lets each person see the level of detail relevant to what they’re actually responsible for.
Embedded Analytics Use Cases
The value becomes clearer when applied to specific operational environments.
- Manufacturing
Production applications can embed monitoring for output, machine utilisation, downtime, rejection rates, quality metrics, inventory, and order progress.
A plant manager can see that Line 3 is running below target directly inside the production workflow, and investigate while the run is still underway, rather than finding out after the fact through a separate report.
2. Logistics
Operational systems can embed shipment status, delivery performance, route efficiency, fleet utilisation, delays, and SLA performance.
This lets a logistics manager spot a pattern of delivery delays and dig into the affected routes without leaving the system they’re already working in.
3. Telecom
Network and maintenance applications can surface tower performance, network availability, outages, and SLA compliance, so operational teams can connect network status directly to the workflows needed to resolve issues.
4. SaaS and Enterprise Applications
Software vendors can embed customer usage, feature adoption, account performance, and subscription metrics, helping customers understand how they’re actually using the product, not just what the product does.
What Should a Good Embedded Analytics Solution Include?
Putting a few charts into an application doesn’t automatically create useful embedded analytics. It needs to be relevant, secure, usable, and tied to the application’s actual purpose.
1. Contextual
A dashboard on a production-order page should show information relevant to that order — not force the user to dig through unrelated organisation-wide metrics.
2. Role-Based Access
Users should only see what they’re authorised to see, which matters most in multi-user, multi-tenant environments where different teams or customers hold different data.
3. Interactive Exploration
Filtering, drill-downs, sorting, comparisons, and time-based views let a user move from “something is wrong” to “here’s exactly where.” For decision-making that goes beyond monitoring, interactive analytics can also let users test different scenarios and see how changing inputs affects outcomes. See our guide to Interactive What-If Analysis using Streamlit for an example of this approach.
4. Data Freshness Matched to the Decision
Not every use case needs real-time data, but in manufacturing, logistics, and telecom, stale information can undercut the value of the insight entirely.
The refresh rate should match how fast the decision needs to be made.
5. Alerts and Exception Monitoring
Users shouldn’t have to keep checking a dashboard to catch a problem. The system should flag it:
Production output falls below threshold → Alert fires → Investigation starts
That shift, from passive reporting to proactive monitoring, is what separates a useful embedded analytics setup from a decorative one.
6. Scalability
Performance needs to hold as user count, data volume, query complexity, and dashboard count all grow. Visibility shouldn’t come at the cost of a slower application.
How to Integrate Embedded Analytics Into an Application
A successful implementation starts with the business problem, not the dashboard.
- Step 1 – Identify the Decision You Want to Improve
Don’t start with “what dashboard should we build?”
Start with “what decision should this data help someone make?”
Why are targets being missed? Which shipments are at risk? Which machines need attention? Which customers are pulling back?
That question keeps the analytics tied to an outcome instead of a visualisation.
- Step 2 – Identify the Required Data
Map which systems hold the information needed to answer that question — often more than one, spanning an ERP, a CRM, an operational database, and an external API.
- Step 3 – Define the KPIs
Decide which metrics actually matter, and resist the urge to include a metric just because the data happens to be available.
A small set of relevant KPIs beats a crowded dashboard.
- Step 4 – Choose the Integration Approach
Options include building native analytics into the application, integrating a BI platform, using APIs or SDKs, embedding visualisation components, or building a dedicated analytics layer.
The right choice depends on customisation needs, security, performance, scalability, and the development resources available.
For a deeper look at lightweight analytical architectures, see DuckDB for Enterprise Analytics: Fast Dashboards Without Heavy Data Warehouses.
- Step 5 – Build the Data Pipeline
The data reaching the application needs to be accurate, consistent, clean, properly structured, and available at the frequency the decision requires.
Analytics are only as reliable as what feeds them.
- Step 6 – Embed the Insight Into the Workflow, Not Alongside It
If a user needs production information while reviewing a work order, that’s where it should appear — not in a separate tab they have to remember to check.
- Step 7 – Implement Security at Every Layer
Authentication, authorisation, role-based access, row-level security, and tenant isolation all need to be designed in from the start.
An embedded dashboard should never expose data just because the user happens to have access to the surrounding application.
- Step 8 – Test Performance and Usability
Confirm dashboards load quickly, queries hold up under realistic workloads, filters behave as expected, and the interface stays usable as datasets grow.
- Step 9 – Monitor and Improve
Track how people actually use the dashboards once they’re live.
A dashboard nobody opens usually means the wrong information is being shown — not that users don’t need analytics at all.
Common Challenges With Embedded Analytics
1. Data Quality
Inconsistent or incomplete source data doesn’t get fixed by embedding it — it just becomes more visible.
Governance needs to be part of the analytics strategy from day one.
2. Performance
Resource-intensive analytical queries can drag down application performance if they run directly against operational databases without the right architecture around them.
3. Security
Embedding analytics adds another layer of data access to secure, which matters even more once an application serves multiple customers or business units.
4. Scalability
A setup that performs fine with a small dataset can behave very differently once data volume and user count grow. Architecture needs to plan for that ahead of time.
5. Information Overload
More charts, KPIs, filters, and alerts don’t automatically mean better analytics.
Past a certain point, they make the application harder to use, not easier. The goal is relevant insight, not maximum information.
6. Ongoing Maintenance
Metrics get redefined, processes evolve, and new data sources get added. Embedded analytics needs continued upkeep, not a one-time build.
From Reporting to Response: AI & Workflow automation
The next stage for embedded analytics isn’t showing users more data; it’s helping them understand what the data means, and connecting that understanding to what happens next.
AI adds capabilities like anomaly detection, natural-language queries, automated summaries, forecasting, and predictive alerts.
The difference shows up in how an insight gets communicated.
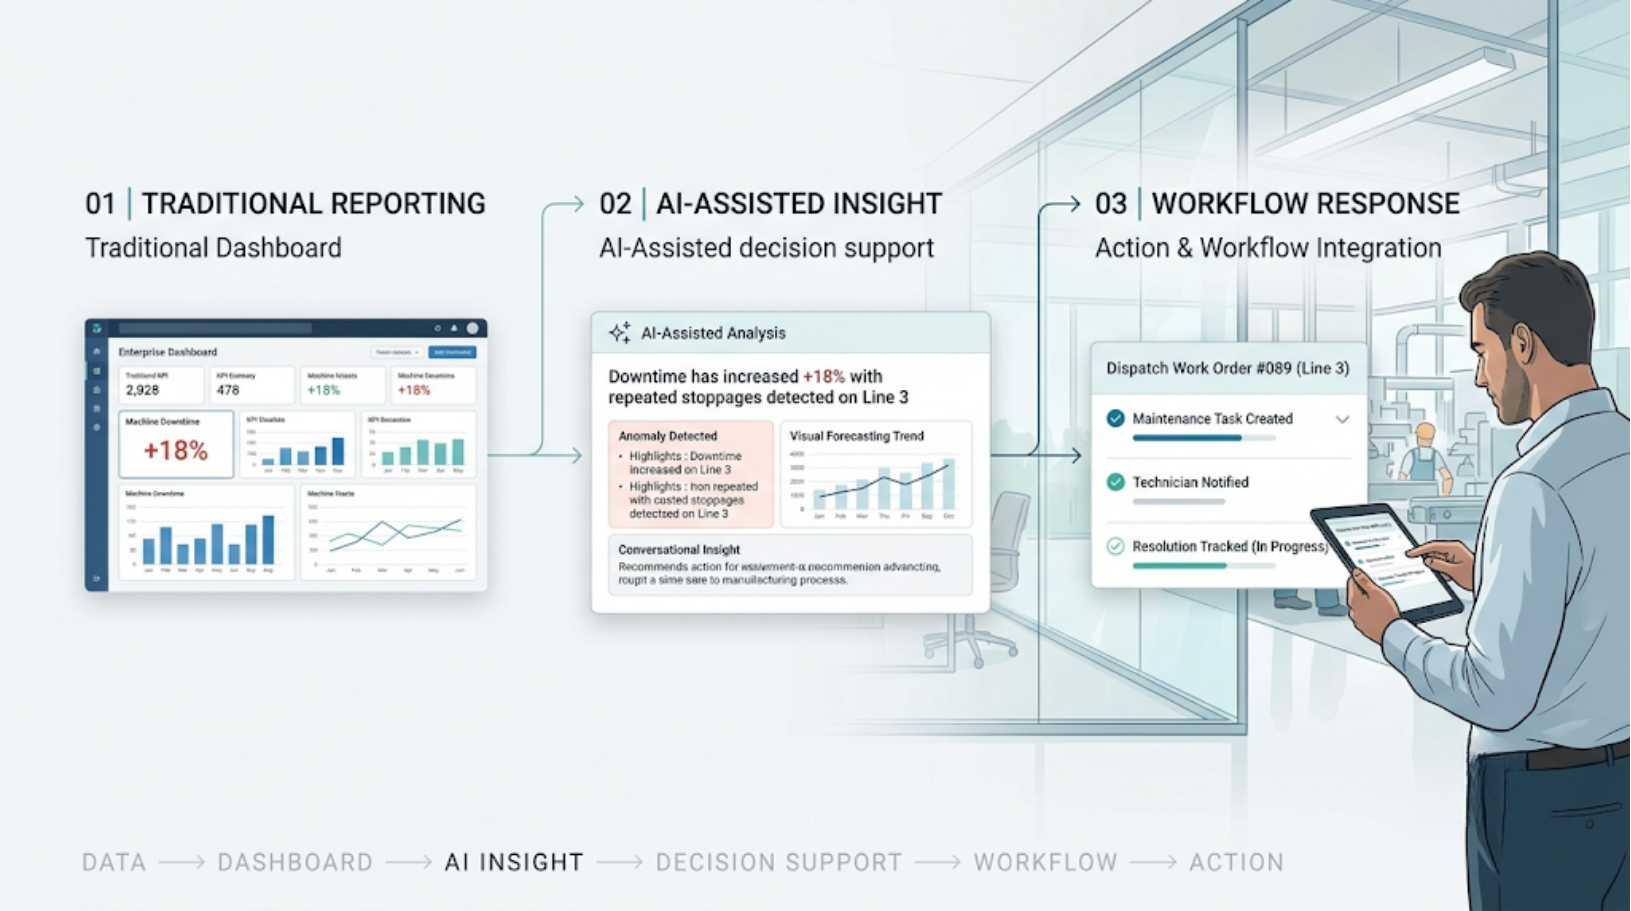
A traditional dashboard might show:
Machine downtime: +18%
An intelligent analytics layer can go further:
“Machine downtime increased 18% this week, with repeated stoppages on Line 3 accounting for most of it.”
The first is information. The second gives someone a starting point for action.
This shift is bigger than any single vendor’s roadmap. Gartner predicts that by 2027, half of all business decisions will be augmented or automated by AI agents built for decision intelligence, systems that don’t just visualise data but actively support and, in some cases, carry out the judgment call that follows it.
Embedded analytics is where a lot of that shift will actually be felt, since it’s already the layer sitting closest to the point of decision.
That’s the real opportunity, not embedding more charts, but embedding decision support.
Data gets generated, analytics flag an issue, the system routes it to a workflow, a task gets assigned, and the resolution gets tracked, all without someone having to manually spot the problem and figure out the next step themselves.
Conclusion
Embedded analytics isn’t simply about placing a dashboard inside an application. It’s about putting the right insight in front of the right person at the moment a decision needs to be made.
As businesses generate more operational data, the harder challenge is no longer collecting or visualising it; it’s turning that data into timely decisions and measurable action.
When analytics are embedded directly into applications and connected to workflows, automation, and increasingly AI, they stop being a separate destination employees have to visit and become part of how the business actually operates.
Data → Insight → Decision → Action
That is where embedded analytics delivers its real value: not just helping teams see what is happening, but helping them respond to it.
Want to connect your operational data with the workflows that act on it?
See how Axxonet can help turn insights into execution.
Frequently Asked Questions
Embedded analytics means placing dashboards, reports, and data visualisations directly inside the application people already use — an ERP, a CRM, a workflow tool — instead of asking them to open a separate BI tool to see the same information.
Traditional BI tools are usually accessed as a separate destination for broad, organisation-wide reporting. Embedded analytics brings a narrower, more contextual set of insights into the application itself, so the user doesn't have to leave their workflow to see them.
The two aren't competitors - many embedded analytics setups are actually powered by a traditional BI engine running underneath the surface.
Most teams don't build it from scratch.
The common approaches are iframe embedding, SDK-based embedding, and full API-based integration. Iframe embedding is generally the quickest to set up but offers less customisation. SDK-based embedding can provide a more native, branded experience with moderate engineering effort. API-based integration offers the most control but requires more development and ongoing maintenance.
The right approach depends on how important the analytics experience is to the application and how much control the team needs.
The main risks are unauthorised data access across users or tenants, and dashboards that expose more than intended because access wasn't scoped tightly enough. Authentication, role-based access, and row-level security all need to be designed in from the start — not added after the dashboard is already live.
Embedded analytics isn't a one-time build. Metrics get redefined, new data sources get added, and dashboards need upkeep as the product evolves. Axxonet can stay involved post-launch to maintain the analytics layer, add new dashboards or KPIs as requirements change, and troubleshoot performance or data issues, rather than handing off a static build and stepping away.
Not always. It depends on how time-sensitive the decision is. A monthly revenue summary doesn't need to update every second. A production-line downtime alert or a delivery-delay notification usually does. The data refresh rate should match how quickly the user needs to act.
AI shifts embedded analytics from showing a number to explaining what the number means — flagging an anomaly, summarising a trend in plain language, or suggesting what caused a spike, rather than leaving the user to interpret a static chart on their own.
It usually starts with mapping the decisions end users actually need to make, then working backwards to the data sources, KPIs, and integration approach that fit the application. From there, Axxonet can take on the data pipeline and the embedded analytics layer end to end, or work alongside an in-house team on specific pieces of it, depending on what the team already has in place.
Start with the decision you want to improve. Identify the specific question a user needs answered like which orders are at risk or, which machines need attention. Then work backwards from there to the data, the KPIs, and the integration method that fits. If that mapping exercise feels like a project in itself, that's usually where Axxonet comes in helping teams work through exactly this before a single dashboard gets built.